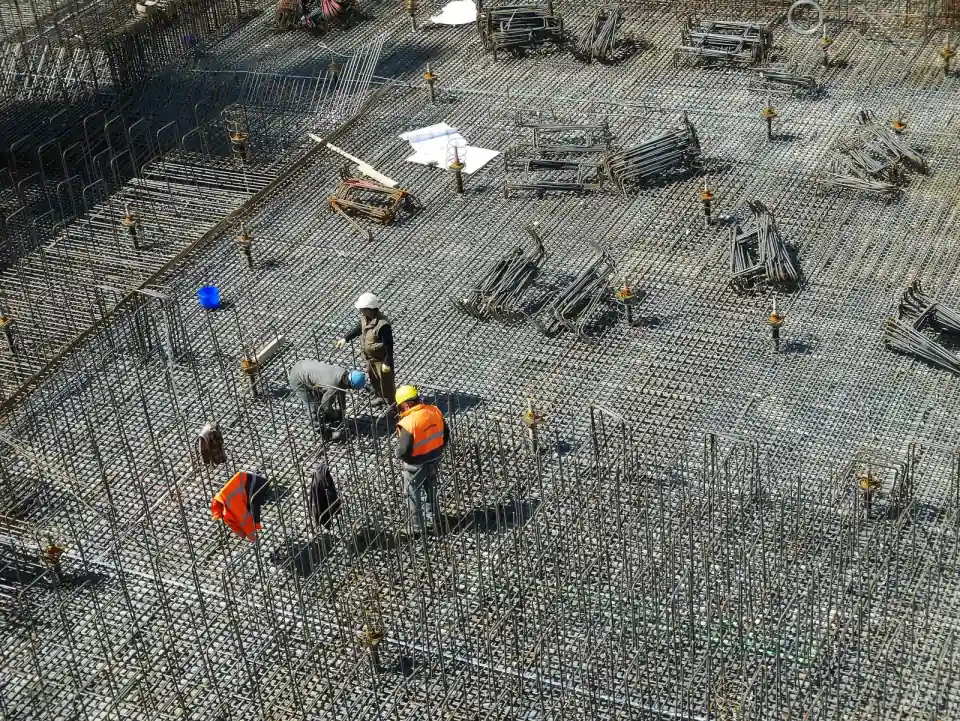
In July, housing starts fell 12.4 percent in a month and 13.5 percent in a year. Building permits rose 5.0 percent. The two numbers reconcile in a line almost nobody reads: 279,000 units are now authorized and not started, up 10.3 percent year over year. The entitlement pipeline is filling while the construction pipeline drains, and the arithmetic in the same release suggests roughly 10,700 approved units quietly left the queue in July without ever breaking ground.
The Census Bureau and HUD released July's new residential construction figures on August 18, 2026, and the headline was ugly. Privately owned housing starts came in at a seasonally adjusted annual rate of 1,239,000, down 12.4 percent from June's revised 1,415,000 and down 13.5 percent from July 2025. Single-family starts fell to 808,000.
The same release, four paragraphs earlier, reported that building permits rose to 1,443,000, up 5.0 percent from June and up 3.1 percent from a year ago, with authorizations for buildings of five units or more at 490,000.
Most coverage picked one of those numbers. The bearish outlets led with starts, the constructive ones led with permits, and both moved on. But the two are not in conflict, and treating them as competing signals misses what is actually happening. They describe different moments in the same process, and the distance between them has a name and a number.
We have written before about what multifamily permit filings say about the next cycle, and that piece treated the permit count as a leading indicator in its own right. This is a different measurement. The subject here is not how many permits are being issued. It is what happens to them afterward.
The number in Table 2
Buried in the release, after the permit and start tables that generate the headlines, is a table almost nobody quotes. It counts housing units that have been authorized by a building permit and have not been started, measured as a stock at the end of the period rather than a monthly flow.
In July 2026 that number was 279,000, seasonally adjusted. It was 268,000 in June and 253,000 in July 2025. That is a 4.1 percent increase in a month and a 10.3 percent increase in a year.
Break it apart and the multifamily component is doing more of the work. Single-family units authorized and not started stood at 149,000, up 9.6 percent year over year. Units in buildings of five or more stood at 127,000, up 11.4 percent year over year.
Hold those two facts side by side, because together they are the entire story of American residential development right now.
Starts: down 13.5 percent year over year. Approved and unbuilt: up 10.3 percent year over year.
The industry did not stop getting entitled. It stopped converting entitlements into holes in the ground. Every one of those 279,000 units has been through a zoning review, a site plan review, a permit application and an approval. Every one of them has a drawing set. None of them has a foundation.
The trend through 2026 is not a one-month blip either. Laid out month by month, the seasonally adjusted backlog has been grinding upward for a year.
| Month | Authorized but not started (SA, thousands) |
| July 2025 | 253 |
| August 2025 | 248 |
| September 2025 | 254 |
| October 2025 | 257 |
| November 2025 | 259 |
| December 2025 | 261 |
| January 2026 | 260 |
| February 2026 | 268 |
| March 2026 | 259 |
| April 2026 | 256 |
| May 2026 | 277 |
| June 2026 | 268 |
| July 2026 | 279 |
Thirteen months, a rise of 26,000 units, and a July reading that is the highest in the series shown. There is month-to-month noise in it, as there is in any survey estimate, and the March and April dip is real. But the direction over a year is unambiguous, and it runs directly counter to every construction number in the same release. This is not a one-month artifact of a bad July.
Worth noting for anyone charting this: the series is a stock rather than a flow, so it should not be plotted on the same axis as starts or permits, which are reported as seasonally adjusted annual rates. A backlog of 279,000 units against a start rate of 1,239,000 units a year means roughly twelve weeks of construction volume is sitting approved and idle.
The rest of the pipeline is draining
To understand why the backlog matters, follow the units through the five stages the Census tracks: permitted, authorized but not started, started, under construction, completed.
Units under construction at the end of July stood at 1,262,000, down 0.2 percent from June and down 6.0 percent from July 2025. Single-family under construction fell to 579,000, down 7.2 percent year over year. The five-plus category held up better at 666,000, down 4.4 percent.
Completions came in at 1,212,000, down 9.1 percent from June and down 16.8 percent from July 2025. Single-family completions were 878,000 and five-plus completions were 329,000, the latter down 25.6 percent year over year.
So the picture across the whole pipeline is consistent. The front is filling. The middle is thinning. The back is emptying fastest of all.
That sequencing is exactly what you would expect if the constraint were capital and cost rather than demand or entitlement capacity. Projects already under construction get finished, which is why completions are still running above 1.2 million. Projects not yet started get held, which is why the not-started backlog is at the top of its recent range. And the stock in between shrinks as the first group graduates out and the second group refuses to enter.
The clearest expression of it is in the five-unit-and-up category alone. Walk a multifamily unit through all five stages, comparing July 2026 against July 2025, and the gradient is almost perfectly monotonic.
| Stage | July 2025 | July 2026 | Change |
| Permits issued (SAAR) | 461,000 | 490,000 | +6.3% |
| Authorized, not started (stock) | 114,000 | 127,000 | +11.4% |
| Starts (SAAR) | 453,000 | 421,000 | -7.1% |
| Under construction (stock) | 697,000 | 666,000 | -4.4% |
| Completions (SAAR) | 442,000 | 329,000 | -25.6% |
Read that column top to bottom. Approvals up. Approvals waiting up more. Starts down. Work in place down. Deliveries down by a quarter.
There is no interpretation of that gradient in which the problem is demand for entitlement or capacity to approve. The approvals are being granted at a faster rate than a year ago, and they are accumulating unbuilt at a faster rate still. The failure is entirely at the conversion step, and it compounds forward: multifamily completions falling 25.6 percent in a year is the mechanical consequence of starts that fell in 2025, just as today's start weakness will show up in 2027 deliveries. Anyone underwriting multifamily supply two years out should be reading the not-started line, not the permit line.
Where the units are going missing
Here is where the release gets genuinely interesting, and it requires setting the seasonally adjusted numbers aside and working with the raw monthly figures instead.
In July, on a not seasonally adjusted basis, 129,900 units were authorized by building permits nationally and 111,200 units were started. If nothing else happened, the not-started backlog should have grown by the difference, roughly 18,700 units.
It grew by 8,000, from 269,900 in June to 277,900 in July.
Roughly 10,700 units are unaccounted for. The Census note on that table explains where they went: the backlog counts units authorized and not started as of the reporting date, and "cancelled, abandoned, expired, and revoked permits are excluded."
Run the same arithmetic by region and the pattern is not uniform.
| Region | Permits issued (July, NSA) | Starts (July, NSA) | Change in not-started backlog | Implied attrition |
| Northeast | 13,000 | 14,800 | -800 | -1,000 |
| Midwest | 21,500 | 16,800 | +2,600 | +2,100 |
| South | 68,600 | 56,200 | +6,100 | +6,300 |
| West | 26,700 | 23,400 | +200 | +3,100 |
| United States | 129,900 | 111,200 | +8,000 | +10,700 |
Two things need saying about that table before anyone quotes it.
First, the Northeast figure is negative, and attrition cannot be negative. That column is a residual, and a residual absorbs every measurement difference between the two surveys that feed it. Permits come from the Building Permits Survey, a non-probability sample of permit-issuing places. Starts and the not-started backlog come from the Survey of Construction, a sample survey with its own standard errors, reported by Census at an average relative standard error of 5 percent on the backlog and 6 percent on starts. The negative Northeast number is the honest evidence that this residual carries noise as well as signal.
Second, with that caveat stated, the direction is consistent across the three largest regions and the national total is large. Somewhere on the order of 10,000 units a month, or roughly 125,000 a year if July is representative, are being permitted and then abandoned, expired or revoked rather than built or banked. That is not a number anyone publishes, and it should be read as an indicative estimate rather than a measurement.
The South is the case worth watching. Southern starts fell 24.1 percent year over year, from 850,000 to 645,000 annualized, and the South is 52 percent of all US housing starts. Yet the southern not-started backlog rose only 1.9 percent over the same twelve months, against increases of 30.4 percent in the Midwest, 23.5 percent in the Northeast and 23.1 percent in the West. Starts collapsed and the backlog barely moved, which means southern entitlements are not being banked at anything like the rate they are being lost.
Two numbers, one apparent contradiction
If you followed trade coverage of this release you may have seen multifamily starts reported as 421,000 in one outlet and 431,000, down 16.8 percent, in another. Both are correct. They are counting different things, and the distinction matters for anyone using these figures in a pro forma.
Census reports starts in the category "units in buildings with five units or more." That figure was 421,000 in July, down 15.6 percent from June.
Several trade bodies, including the homebuilders' association, report "multifamily" as buildings with two or more units, which adds the two-to-four unit category. Census suppresses the seasonally adjusted two-to-four unit series because it does not meet publication standards for stable seasonality, but the unadjusted annual figures put that category at 18,000 to 19,000 units a year. Add it and you get roughly 431,000 for July against roughly 518,000 for June, which is a decline of 16.8 percent.
So the 421,000 and the 431,000 are the same month measured against two definitions that differ by the two-to-four unit stock, and the 15.6 percent and 16.8 percent declines are the same event. Anyone comparing a multifamily figure across sources should check which threshold is in use before concluding the data disagrees with itself.
The same trap catches the not-started series. Census publishes it both seasonally adjusted and unadjusted, and the two differ by enough to change a narrative: 279,000 adjusted against 277,900 unadjusted in July, which is close, but 261,000 adjusted against 133,500 unadjusted in December, which is not close at all, because permit activity is heavily seasonal and December is its trough. The series is also carried on the St. Louis Fed's FRED database, disaggregated by structure type and Census region, where the default single-family series is not seasonally adjusted. Pulling a December figure from one source and a July figure from another and comparing them will produce a collapse that did not happen.
Why the units are not starting
The gap between an approval and a groundbreaking is where financing, pricing and risk get resolved, and all three moved against developers in 2026.
Construction costs spiked at the start of the year. Construction input prices rose at a 12.6 percent annualized rate during the first two months of 2026, the fastest pace since early 2022, according to analysis of Producer Price Index data by Associated Builders and Contractors chief economist Anirban Basu. Cumulatively, input prices rose more in the first four months of 2026 than over the prior three years combined. By July the monthly rate had flattened, with input prices virtually unchanged month over month but still up 7.4 percent year over year and 7.2 percent for nonresidential, and Basu warned that increases in lumber, iron and steel plus a rebound in diesel would push them higher again.
A project underwritten in mid-2025 and permitted in early 2026 may have cleared entitlement carrying a hard cost number that no longer clears its own return threshold. It does not get cancelled. It gets held, and it shows up in Table 2.
Construction lending never really loosened. The Federal Reserve's July 2026 Senior Loan Officer Opinion Survey reported that standards for construction and land development loans remained basically unchanged on net over the second quarter, with a moderate net share of foreign banks tightening commercial real estate standards and modest to moderate net shares easing for nonfarm nonresidential and multifamily. (10) The word doing the work there is "unchanged." Construction and land development standards have been historically restrictive in level for several years, and a quarter in which they do not tighten further is not a quarter in which capital becomes available to a marginal project.
Rates have not moved. The federal funds target range has been held at 3.50 to 3.75 percent, most recently at the July 29, 2026 meeting. The next decision comes at the September 2026 meeting, and as of late August, futures pricing implied roughly a 59 percent probability of no change. That is a market expectation derived from fed funds futures rather than a forecast of what the committee will do, and it moves daily.
Put those three together and the behavior in the data is rational. If you hold an approval, holding costs are low relative to the cost of building into a market where your hard costs rose 7 percent, your construction loan is priced off a rate that has not fallen, and your lender's standards have not eased. So you file, you get approved, and you wait. Permits have a shelf life, which is why some of that backlog is quietly expiring, but the shelf life is usually measured in a year or two and most sponsors would rather burn the option than build at a loss.
The nonresidential mirror
The same divergence is visible on the commercial side, in two indices that are usually read as contradicting each other and in fact are not.
The AIA and Deltek Architecture Billings Index came in at 46.6 in July 2026, down from 47.3 in June, extending what the profession's own coverage describes as the longest slump in the index's history, with contraction signaled in 45 of the last 46 months. Any reading below 50 indicates declining billings. Within the July report, project inquiries were positive at 52.6 while the value of newly signed design contracts fell to 47.2, which is the same story in miniature: clients are asking, and then not signing. The AIA describes the ABI as leading nonresidential construction activity by roughly nine to twelve months, so a July reading in the mid-forties points at continued weakness well into 2027.
The regional detail in that report is worth reading alongside the residential regional numbers, because the two do not line up. The July ABI regional readings were South 48.7, West 47.8, Midwest 46.7 and Northeast 44.8, with the Northeast weakest for the second consecutive month. The residential release, by contrast, showed the South as the epicentre of the starts decline and the Northeast as nominally the strongest region. That is not a contradiction to resolve so much as a reminder that these are different building types, different clients and different capital sources, and that a single regional story about American construction in 2026 does not exist.
Meanwhile the Dodge Momentum Index, which tracks nonresidential projects entering the planning stage, rose 6.9 percent in July to 291.7 against an upwardly revised 273.0 in June, with commercial planning up 4.1 percent and institutional planning up 13.1 percent.
Read carelessly, those two indices look like they are describing different economies. They are not. The Momentum Index measures projects entering planning. The Billings Index measures work being billed now. Planning activity is rising while billable work falls, which is precisely the commercial analogue of permits rising while starts fall. Projects are being conceived, scoped and queued. They are not being executed.
What this means for the people who draw the plans
There is a version of this data that reads as straightforwardly bad news for anyone in pre-construction. Starts down 13.5 percent, completions down 16.8 percent, billings in the mid-forties for the better part of four years. That reading is incomplete.
Consider what the 279,000 figure actually represents from a production standpoint. It is a book of approved projects, each with a site plan, a survey, a grading and drainage design, a landscape plan and a set of conditions of approval, sitting in a drawer waiting for the cost of capital or the cost of steel to move. And several things reliably happen to a project that sits.
Approvals expire and conditions change. A site plan approval carries a validity period, commonly one to three years depending on the jurisdiction, with extension procedures that frequently require resubmittal against whatever code is current at the time of extension rather than at the time of original approval. A project approved in early 2025 that starts in late 2027 may be re-reviewed against a stormwater manual, an energy code or a parking standard that has since been amended. The roughly 10,700 units a month implied to be leaving the pipeline are partly this: entitlements that aged out.
Held projects get value engineered. A sponsor holding an approval into a higher cost environment does not usually shelve it permanently. They redesign it. Unit counts get revisited, structured parking becomes surface parking, building geometry gets simplified, the stormwater strategy gets re-examined for a cheaper approach. Each of those is a redraw against an approved plan, which is a different and often more delicate exercise than drawing it the first time, because the changes have to be defensible against the conditions of the original approval.
The queue does not clear gradually. If the constraint is capital cost rather than demand, then the release of that constraint is a step change rather than a ramp. The projects that unfreeze do so roughly together, and they arrive at the same design and engineering capacity at the same moment. A backlog at the top of its range is a forward workload, and it is not evenly distributed in time.
The middle of the pipeline is thinning faster than the front is filling. Run the stages against each other. Units under construction fell 6.0 percent year over year while completions fell 16.8 percent and starts fell 13.5 percent. A construction stock that is shrinking more slowly than either the inflow or the outflow means projects are sitting under construction longer, which is consistent with the schedule extensions that hard cost inflation and trade availability produce. For anyone doing construction administration or responding to field questions, that is a workload that stretches rather than disappears.
This is why pre-construction work behaves differently from construction work through a cycle. Site planning, entitlement and design capacity are consumed both on the way down, as sponsors hold and revise, and on the way up, as the queue converts. It is the pouring of concrete that stops, and concrete is not what is in the drawer.
The practical posture that follows is not complicated. Sponsors holding approvals should know their expiry dates and their extension procedures before they need them, because a lapsed approval re-entering review under a current code is the most expensive version of this problem. Design teams should treat a held project as a live file rather than a closed one, since the redesign request arrives with a short fuse when financing moves. And anyone underwriting new acquisitions should read the 279,000 as what it is, which is competitive supply that is already approved and can move faster than an unentitled site can.
What would change this reading
Three specific things, on known dates.
The August new residential construction release publishes September 17, 2026, and will carry a revision to July. Census notes that preliminary seasonally adjusted estimates of total permits, starts and completions are revised by 2.9 percent or less on average, so the July starts figure is unlikely to move dramatically, but the direction of the August number matters more than the revision. Two consecutive months of starts near 1.24 million would establish a level rather than a stumble.
The September FOMC decision lands in the same week. A cut would not move a single project in the backlog by itself, but it would change the trajectory of construction loan pricing, and the backlog is a call option on exactly that.
And the input price series bears watching more than either. Basu's warning about lumber, iron, steel and diesel is the variable that determines whether a held project pencils on the day the financing improves. A rate cut into rising hard costs converts fewer approvals than a flat rate into flat costs.
One caution on the confidence intervals, because this release is noisier than the headlines suggest. The Northeast showed starts up 62.4 percent year over year in July, which sounds like a boom. The 90 percent confidence interval on that figure is plus or minus 93.7 percent. It is statistically indistinguishable from no change at all, and anyone building a regional thesis on it is building on sampling error. The national starts decline of 13.5 percent, at plus or minus 11.0 percent, is significant. The 10.3 percent rise in the not-started backlog, at plus or minus 7.3 percent, is significant. Most of the regional detail in a single month is not.
The gap is the business
Development commentary tends to treat permits and starts as two readings of the same instrument, and to get uncomfortable when they disagree. They are not the same instrument. A permit records a decision to be allowed to build. A start records a decision to actually build. Those are separate decisions, made by different people against different information, sometimes years apart.
In July 2026 the first decision was being made more often and the second less often, and the distance between them widened to 279,000 units. That distance is not a data problem. It is a stage of the development process, and it is currently the most populated stage in American residential construction.
It is also the stage with the least visibility. Starts get reported on the morning of release. Completions get counted. Permits get tracked by county and metro and fed into a hundred market reports. The units sitting between approval and groundbreaking get one table, no headline, and almost no analysis, which is peculiar given that they represent roughly twelve weeks of national construction volume and a book of projects that has already absorbed most of its soft costs.
For a developer, that table is a supply forecast that nobody else is reading. For a lender, it is a measure of how much approved product could arrive quickly if pricing improves. For a design team, it is a workload that has been deferred rather than cancelled.
Everything in it has already been drawn once. A good deal of it will be drawn again.
Frequently Asked Questions
What does "authorized but not started" mean? It is a Census Bureau series counting housing units that have received a building permit but on which construction has not begun, measured as a stock at the end of each month rather than as a monthly flow. Cancelled, abandoned, expired and revoked permits are excluded from the count. It appears as Table 2 of the monthly New Residential Construction release and is the most direct available measure of the entitled but unbuilt pipeline.
How many housing units are permitted and not being built? 279,000 as of July 2026 on a seasonally adjusted basis, up 4.1 percent from June and up 10.3 percent from July 2025. Of that, 149,000 are single-family units and 127,000 are units in buildings of five or more.
How can permits rise while starts fall? They measure different decisions at different points in the process. A permit records approval to build. A start records the commencement of construction. When financing costs, hard costs or market conditions worsen between the two, sponsors continue pursuing approvals, which are relatively cheap and preserve optionality, while deferring construction, which is not. The gap accumulates in the authorized but not started series.
Why do sources report July multifamily starts as both 421,000 and 431,000? Because of a definitional difference. Census reports "units in buildings with five units or more," which was 421,000 in July, down 15.6 percent from June. Some trade bodies define multifamily as buildings with two or more units, adding a two-to-four unit category that runs roughly 18,000 to 19,000 units annually, which produces roughly 431,000 and a decline of 16.8 percent. Both figures describe the same month.
Which region saw the largest decline in starts? The South, down 24.1 percent year over year, from 850,000 to 645,000 annualized. That matters disproportionately because the South accounts for roughly 52 percent of all US housing starts. The Midwest fell 27.0 percent. The Northeast showed a 62.4 percent increase, but with a 90 percent confidence interval of plus or minus 93.7 percent, that figure is statistically indistinguishable from no change.
Are approved projects being abandoned? The release does not report abandonment directly, but the arithmetic implies it. In July, 129,900 units were permitted and 111,200 were started on an unadjusted basis, a net inflow of 18,700, while the not-started backlog rose only 8,000. The roughly 10,700 unit difference corresponds to what the Census note excludes from the backlog: cancelled, abandoned, expired and revoked permits. Treat that as an indicative estimate rather than a measurement, since the permit and start figures come from different surveys with their own sampling error.
What is the Architecture Billings Index saying? The July 2026 reading was 46.6, down from 47.3 in June, with any figure below 50 indicating declining billings. The index has signaled contraction in 45 of the last 46 months, the longest slump in its history. Within the July report, project inquiries were positive at 52.6 while newly signed design contracts fell to 47.2. The AIA describes the index as leading nonresidential construction activity by roughly nine to twelve months.
Does a rising Dodge Momentum Index contradict a falling ABI? No. The Dodge Momentum Index tracks nonresidential projects entering the planning stage and rose 6.9 percent in July to 291.7. The Architecture Billings Index tracks work being billed now. Planning rising while billings fall is the commercial equivalent of permits rising while starts fall, and both describe a pipeline filling at the front and draining in the middle.
When is the next data release? The August 2026 new residential construction release publishes September 17, 2026, and will include a revision to the July figures. Census notes that preliminary seasonally adjusted estimates of total permits, starts and completions are revised by an average of 2.9 percent or less.
Sources:
- United States Census Bureau and United States Department of Housing and Urban Development, Monthly New Residential Construction, July 2026, release number CB26-127, August 18, 2026
- United States Census Bureau and HUD, New Residential Construction July 2026, Table 2, New Privately-Owned Housing Units Authorized, but Not Started, at End of Period
- United States Census Bureau and HUD, New Residential Construction July 2026, Table 4, New Privately-Owned Housing Units Under Construction at End of Period
- United States Census Bureau and HUD, New Residential Construction July 2026, Table 5, New Privately-Owned Housing Units Completed
- United States Census Bureau and HUD, New Residential Construction July 2026, Table 3, New Privately-Owned Housing Units Started
- United States Census Bureau, New Residential Construction, Explanatory Notes and survey methodology
- Associated Builders and Contractors, construction input price analysis, Anirban Basu
- Construction Dive, coverage of construction input prices, February 2026
- Associated Builders and Contractors, construction materials prices flat in July, up 7.4 percent from a year ago
- Board of Governors of the Federal Reserve System, Senior Loan Officer Opinion Survey on Bank Lending Practices, July 2026
- Board of Governors of the Federal Reserve System, Federal Open Market Committee statement, July 29, 2026
- CME FedWatch, fed funds futures implied probabilities, late August 2026
- The American Institute of Architects and Deltek, Architecture Billings Index, July 2026
- Architect Magazine, coverage of the July 2026 Architecture Billings Index
- Dodge Construction Network, Dodge Momentum Index Improves 7 Percent in July
- United States Census Bureau, Economic Indicators release schedule
- National Association of Home Builders, multifamily construction commentary, August 2026
- United States Census Bureau, New Residential Construction, historical time series
- Federal Reserve Bank of St. Louis, FRED, New Privately-Owned Housing Units Authorized but Not Started series
- USGlass Magazine, Architecture Billings Index falls in July, extending industry slump