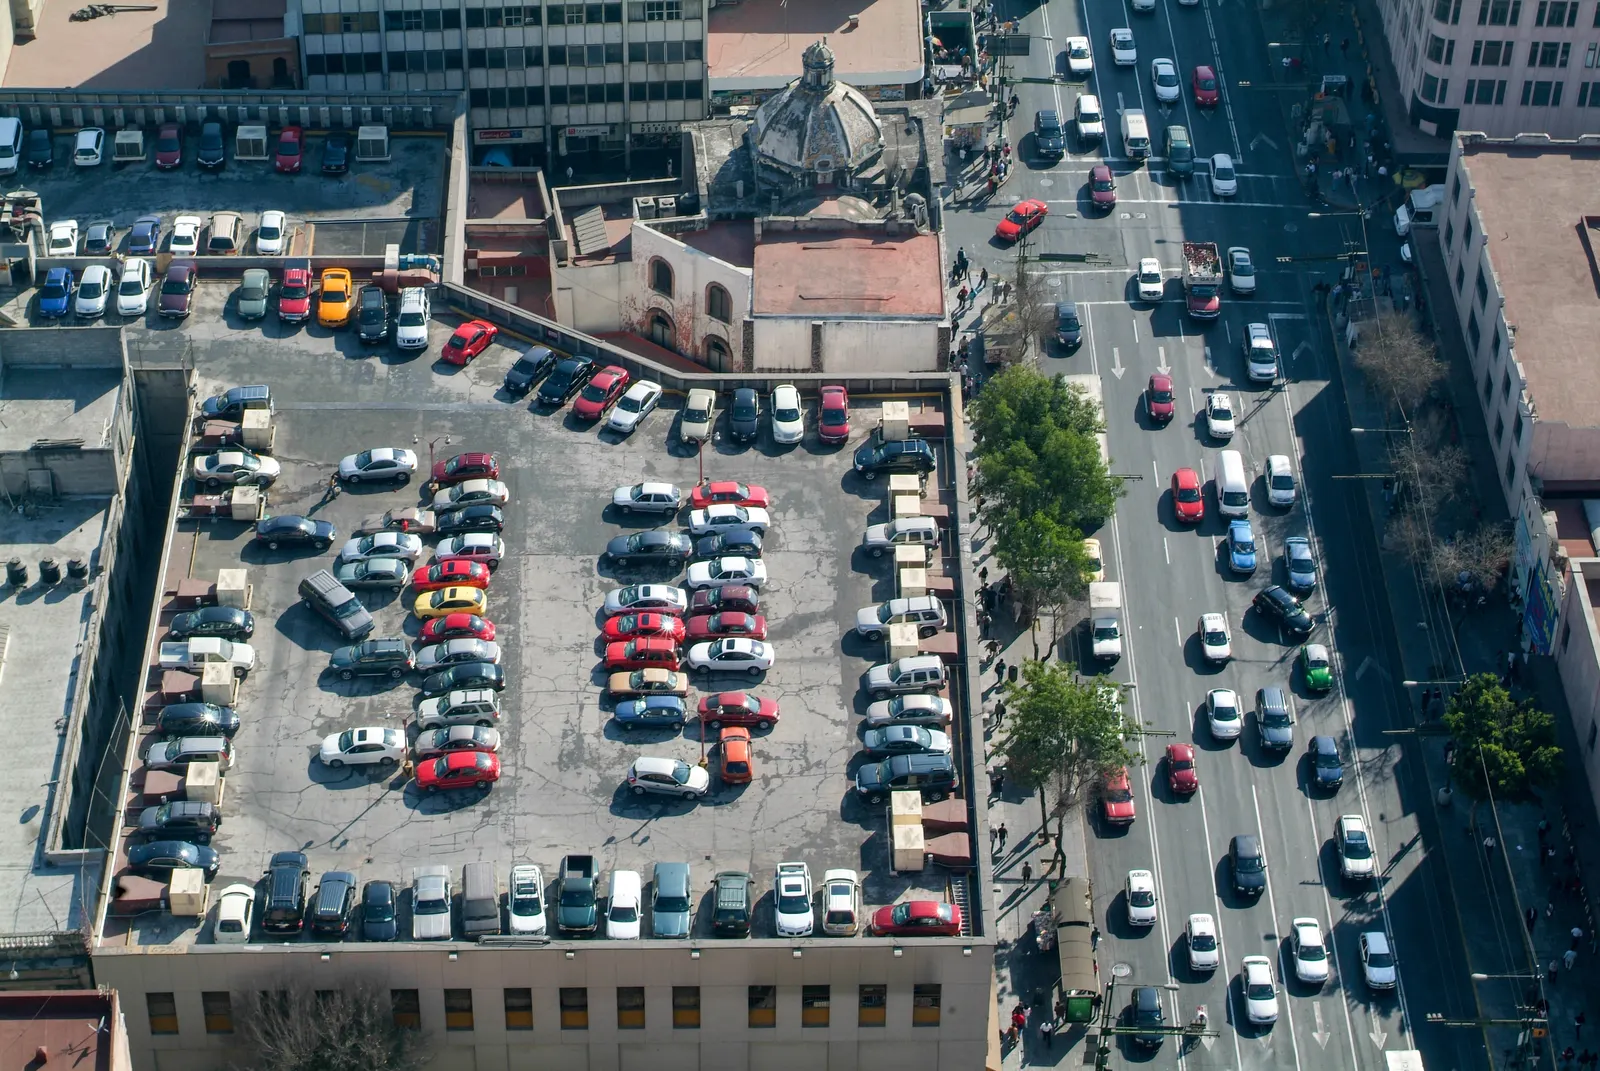
Raleigh's development code caps combined required landscaping at 30 percent of a commercial lot. Tampa requires 25 percent tree retention on commercial parcels. Houston requires 0.75 acre-feet of detention storage for every acre of impervious cover, rising toward 1.0 as coverage climbs. Each of those rules sits in a different chapter, is administered by a different reviewer, and has never been added to the others. We ran the sum across twelve markets, and the landscape leg turned out to be the one nobody had ever compiled.
The research stops at parking
Every serious measurement of how much land American development regulation consumes is a parking study. Donald Shoup set the frame in 1999: at 300 square feet per space including aisles, a 20-space mandate on a 2,000-square-foot restaurant produces 6,000 square feet of parking, three times the building. Cutter and Franco modeled Los Angeles County commercial parcels in 2012 and found minimum parking requirements function as an indirect density cap, increasing land consumption and reducing profit per unit of land. Gabbe and Pierce measured Seattle after reform across 868 developments and 60,361 units, where developers built roughly 40 percent less parking than the prior requirements demanded, about 18,000 fewer spaces and an estimated $537 million saved. Hess and Rehler found that 47 percent of major Buffalo developments included fewer spaces than previously permissible after minimums were dropped, with mixed-use projects building 53 percent fewer. The Parking Reform Network's 2023 mapping put 24 percent of downtown Dallas under parking and estimated about 20 percent across the city centers it analyzed.
That is a real literature. It is also a literature about one constraint, and it arrived just as that constraint started disappearing.
Parking is now the fastest-shrinking rule on the list
Across the twelve markets we tracked, four have repealed commercial minimums citywide: Raleigh in March 2022, replacing them with maximums, Austin in November 2023, Dallas in May 2025, and Denver in August 2025. Three repealed only inside defined districts: Nashville within its Urban Zoning Overlay, Columbus in its transit-corridor districts, and Kansas City in the urban core. Charlotte moved to a tiered system where the outermost tier carries no minimum. Phoenix, Tampa, and Houston reduced rather than repealed, Houston through market-based parking areas.
Developers who expected the recovered land to show up on the site plan mostly did not get it, because three other rules were already holding the ground.
The leg nobody compiled
Landscape, buffer, and tree requirements are the least standardized of the four constraints and the only one with no comparative source anywhere in the public record. Six of the twelve markets publish a figure you can read directly off the page:
Raleigh caps combined required landscaping, meaning parking lot planting plus protective yards plus tree conservation, at 30 percent of lot area under UDO Section 7.2.2.
Tampa requires 25 percent tree retention on commercial and industrial parcels, with the green space calculation excluding building and paving.
Nashville caps the landscape buffer yard at 20 percent of lot area, above which an adjustment is triggered, and sets nonresidential tree density at 22 tree density units per acre.
Dallas requires a 20 percent minimum landscape area for non-single-family shared access developments, plus one site tree per 4,000 square feet and a buffer strip carrying one large canopy tree per 50 linear feet.
Charlotte requires a 15 percent tree-save area on first-time commercial development, on top of interior, perimeter, and frontage tree requirements.
Houston sets a base requirement in Chapter 33 that reduces to 10 percent of the site where landscaping is used for screened parking, with one parking lot tree per ten spaces and every space within 120 feet of a tree.
The other six publish no site-wide percentage at all. Atlanta, Austin, Columbus, Denver, Phoenix, and Kansas City express the same requirement indirectly, through separate perimeter buffers, interior parking islands, street tree spacing, and canopy or density targets that a designer has to sum per site. That is why the number has never been compared: in half the markets it does not exist as a number until someone draws it.
Raleigh shows how it accrues even where a cap exists. One shade tree per 2,000 square feet of parking, one per 4,000 in urban and transit districts. A terminal island at the end of every row, with no more than 30 spaces between islands. A six-foot median every six rows. Islands averaging 20 feet wide with a 300-square-foot minimum planting area and trees every 50 feet. Add protective yards by adjacency and tree conservation area, and you reach a cap that exists because without it the sum would go higher.
The part that converts to cash
Tree replacement carries a fee in lieu, and the rates function as an impact fee that appears in no impact fee schedule. It is assessed per inch of trunk removed rather than per unit built, so it scales with the site's existing canopy instead of the project's intensity.
Atlanta adopted $140.00 per DBH inch into its Tree Trust Fund effective January 1, 2026, CPI-adjusted from 2027. Kansas City set $185.00 per caliper inch in an ordinance adopted March 2023. Dallas carries a base Reforestation Fund rate of $193.00 per caliper inch. Raleigh charges $100.00 per caliper inch for restoration, with a secondary tree conservation area fee tied to land tax value. Charlotte assesses $500.00 per heritage tree in mitigation and $200.00 per inch for unauthorized removal. Houston's parkway replacement runs on a tiered schedule of $225.00 per inch up to six inches, $375.00 above six to twelve, and $500.00 above twelve.
On a wooded four-acre commercial parcel, the difference between the Raleigh rate and the Dallas rate is not a rounding item. It is a line that should appear in the land basis before the offer goes out.
The detention leg, converted to land
Eight of the twelve markets set a fixed treatment depth: Atlanta at 1.2 inches, Columbus at 0.90, Charlotte, Raleigh, and Nashville at 1.0, Dallas under the regional iSWM standard at 1.5, and Tampa at 1.0 for wet detention. Converting those to surface basin footprint at 85 percent impervious cover, using a four-foot basin with 2.5 feet of effective storage depth, water quality volume alone claims roughly 1.5 to 4 percent of a site. Those are our calculations from the standard runoff coefficient method, not published municipal figures, and actual sizing depends on curve number, soils, and routing.
More to the point, water quality volume is typically only 20 to 40 percent of total required storage. Peak attenuation stacks on top of it, and in most of these markets that attenuation is performance-based, meaning the volume is whatever it takes to hold the post-development peak to the pre-development rate.
Two markets skip the ambiguity and publish the take directly. Houston requires a base 0.75 acre-feet per acre of impervious generating area on tracts of 20 acres or less, rising toward 1.0 with coverage, with Harris County setting 0.65 for larger tracts. On a three-acre Houston pad, 0.75 acre-feet per acre is 2.25 acre-feet, roughly 0.90 acre of surface basin at 2.5 feet of effective depth, close to 30 percent of the site and about 121 stalls at 325 square feet per stall including aisle. Phoenix requires on-site retention of the 100-year two-hour event, a 2.5 inch storm, with no positive outfall, which computes to roughly 7 percent of a site in a four-foot basin.
The missing fourth leg, and why it matters
Setbacks and lot coverage caps live in per-district dimensional tables across twelve separate codes, and no compiled comparative source exists for commercial districts. Houston does not have conventional zoning at all, so its coverage and setback analysis runs through Chapter 42 rather than a district table.
We are stating that plainly rather than estimating it, which means every figure above is a floor. The stack we can compute is the stack before setbacks.
What the floor looks like
In Raleigh, the code's own cap on required landscaping is 30 percent, and water quality volume alone adds roughly 3 percent. That is a third of the lot before peak attenuation, before setbacks, and before parking, which Raleigh no longer requires but now caps.
In Tampa, 25 percent tree retention plus roughly 3 percent for treatment volume.
In Nashville, a 20 percent buffer yard trigger plus roughly 3 percent, with karst geology restricting infiltration over sinkholes and pushing storage toward surface volume.
In Houston, the reduced 10 percent landscape figure plus roughly 30 percent detention on a three-acre pad, which is the highest computable stack in the set and the clearest case of one constraint dominating the others.
None of these markets is unusual. They are the twelve most active commercial development markets in the country, and in each one the code claims somewhere between a fifth and a third of a commercial acre before an architect places a building.
Where this belongs in the process
The stack is knowable at site selection and it is almost never computed there. Landscape percentage, tree fee exposure, and detention rate are all published or derivable from published rules, and together they set the developable area that the pro forma is quietly assuming. A test fit run against the four constraints before the offer is a two-day exercise. A test fit run against them after closing is a repricing.
Frequently asked questions
How much of a commercial acre does municipal code actually consume?
Across the twelve markets we measured, the computable stack of landscape, buffer, tree, and stormwater requirements runs from roughly 18 percent to more than 40 percent of a commercial lot before setbacks and lot coverage caps are added. Raleigh caps required landscaping alone at 30 percent, and Houston's published detention rate can claim close to 30 percent of a small pad by itself.
Did parking reform give the land back?
Only partially, and only in some markets. Four of the twelve repealed commercial minimums citywide, three repealed only in defined districts, and the rest reduced rather than removed them. Where minimums went away, landscape, buffer, and detention requirements stayed, so the recovered area is smaller than the reform headline suggests.
What is a tree fee in lieu and how much is it?
It is a payment made when protected trees are removed and cannot be replaced on site, assessed per inch of trunk diameter. Adopted rates in the markets we reviewed include $100 per caliper inch in Raleigh, $140 per DBH inch in Atlanta as of January 2026, $185 in Kansas City, and $193 in Dallas, with Charlotte assessing $500 per heritage tree.
Can underground detention recover the land a basin takes?
Often, and the crossover is a land value question. When a surface basin exceeds roughly 10 percent of gross site area or displaces the stalls a tenant requires, underground storage usually prices in. Feasibility is site-specific: shallow water tables, karst, and infiltration restrictions limit the options in several of these markets.
Sources:
- Raleigh Unified Development Ordinance, Chapter 7, Sections 7.1.7, 7.2.2, and 7.2.4, and Article 9.1 tree conservation
- City of Tampa Code, Chapter 13 and Chapter 27, tree retention and green space
- Metro Nashville Zoning Code, Title 17.24, buffer yards and tree density units
- Dallas Development Code, Chapter 51A Article X, Sections 51A-10.125 and 51A-10.135
- Charlotte Unified Development Ordinance, Article 20, tree save and heritage tree mitigation
- City of Houston Code of Ordinances, Chapter 33 Article V, Sections 33-126 through 33-128
- City of Atlanta Code, Section 158-103, and City of Atlanta adopted tree recompense schedule effective January 1, 2026
- Kansas City Zoning and Development Code, Sections 88-424 and 88-425
- City of Houston Infrastructure Design Manual, Chapter 9, detention criteria
- Harris County Flood Control District Policy, Criteria and Procedure Manual, detention minimums
- City of Phoenix Storm Drainage Design Manual and Maricopa County Drainage Design Manual
- Georgia Stormwater Management Manual, water quality volume standard
- Ohio EPA construction general permit OHC000006, water quality volume standard
- North Carolina Administrative Code 15A NCAC 02H .1000, post-construction stormwater standards
- Tennessee permanent stormwater management manual, runoff reduction standard
- Southwest Florida Water Management District Environmental Resource Permit Applicant's Handbook, Volume II
- North Central Texas Council of Governments iSWM technical manual, water quality volume
- Donald Shoup, The trouble with minimum parking requirements, Transportation Research Part A, volume 33, 1999
- W. Bowman Cutter and Sofia F. Franco, Do parking requirements significantly increase the area dedicated to parking, Transportation Research Part A, volume 46, number 6, 2012
- C.J. Gabbe, Gregory Pierce and others, Parking policy: the effects of residential minimum parking requirements in Seattle, Land Use Policy, volume 91, 2020
- Daniel Baldwin Hess and Jeffrey Rehler, Minus Minimums, Journal of the American Planning Association, volume 87, number 3, 2021
- Parking Reform Network, 2023 Parking Lot Map, downtown land share analysis
- City of Austin Ordinance 20231102-028, parking minimum repeal
- City of Dallas parking minimum repeal, adopted May 14, 2025
- City of Denver zoning text amendment removing parking minimums, effective August 11, 2025
- Raleigh Text Change TC-11-21, parking minimum repeal, March 2022
- Charlotte Unified Development Ordinance, Article 19, tiered parking standards
- Metro Nashville Ordinance BL2022-1412, Urban Zoning Overlay parking
- City of Columbus Zoning Code, Section 3312.49, and transit-corridor district amendments
- City of Phoenix Zoning Ordinance, Section 702, parking reductions