
Long Island and NYC Office Market Mid-2025: Data-Driven Analysis for Investors
- Alketa

- Jul 4, 2025
- 23 min read
Executive Summary
The mid-2025 office market trends in Long Island and New York City reveal a tale of two recoveries. New York City’s office sector is rebounding strongly, with Manhattan logging its highest annual leasing volume since the pandemic began. Total new leases in Manhattan reached over 27 million SF in 2024 (up 16% year-over-year), and positive net absorption has been recorded for four consecutive quarters for the first time since 2019. Long Island’s office market, by contrast, has stabilized at a slower pace, but notably 2024 marked its first year of positive absorption since 2018 as tenants’ space reductions bottomed out. Vacancy rates underscore the divergence: NYC’s overall office vacancy sits around 13.5%, higher than Long Island’s tighter 8.4%. Rent performance also differs – NYC’s asking rents have inched up only ~0.6% over the past year amid tenant-favorable conditions, while Long Island’s rents grew about 2.0% year-over-year (still below its historical norm). Investor sentiment reflects these fundamentals: New York City offers higher risk-reward with pockets of distress and opportunity, whereas Long Island offers stability with lower growth. In summary, NYC’s office market is showing renewed demand and a flight to quality that outpaces national trends, while Long Island’s market remains steady, with low vacancies but modest rent momentum, thanks to limited new supply and a resilient tenant base.
Architectural Evolution and Landmark Developments
Hudson Yards’ mega-development introduced several modern office towers to Manhattan’s skyline by 2020, exemplifying the last cycle’s wave of trophy construction. Projects like Hudson Yards and the upcoming 270 Park Avenue headquarters showcase a trend toward amenity-rich, sustainably designed buildings that attract top-tier tenants.
New York City has seen a transformative development boom in the past decade, highlighted by mega-projects and cutting-edge towers. The Hudson Yards project on Manhattan’s West Side delivered millions of square feet of new Grade A office space, redefining the skyline and setting a new standard for workplace amenities. Over in Midtown East, the new JPMorgan Chase headquarters at 270 Park Avenue (2.5 million SF) is on track to open in late 2025 and will be fully occupied by JPMorgan upon delivery – a testament to the demand for next-generation office buildings even as older stock struggles. Overall construction activity in NYC is now slowing dramatically: only about 9 million SF remains under construction (down from 21 million SF in early 2020), and new starts in 2024 totaled under 300,000 SF – the fewest in 30 years. Developers and lenders have pulled back on speculative projects amid uncertain office demand, even pausing projects like 3 Hudson Boulevard (a planned 1.9M SF tower) until anchor tenants and financing are secured. If anything, this construction cooldown is relieving future supply pressure: most ongoing projects are fully or mostly pre-leased (e.g. Disney’s 1.2M SF 7 Hudson Square completed in 2024 is entirely owner-occupied). It also means New York may not see another large office tower built before 2030 under current trends. With tenants gravitating to modern, transit-oriented towers, many older buildings face obsolescence. Landlords of aging offices are pursuing major renovations or, increasingly, adaptive reuse. City officials have encouraged office-to-residential conversions, and entire buildings are already coming offline for redevelopment – for example, 170 Water Street and 4 New York Plaza in Lower Manhattan are being converted to apartments. In fact, owners of roughly 60 office buildings (totaling about 10 million SF) have inquired about residential conversion opportunities. This push for adaptive reuse reflects a broader architectural evolution in NYC: trophy new developments thrive (especially near transit hubs like Hudson Yards, Grand Central, and Penn Station), while outdated offices are either upgraded or removed from the inventory to make way for new uses.

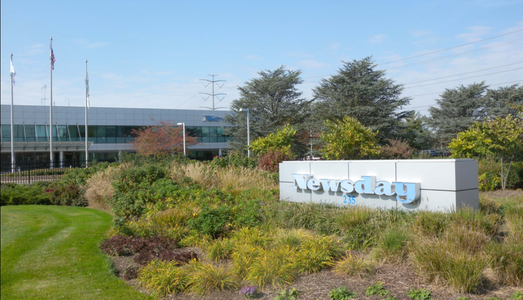
Suburban office campuses dominate Long Island’s landscape. Pictured is the low-rise headquarters of Newsday in Melville, one of Long Island’s major corporate hubs. Such spread-out office centers define the island’s office market, which has seen little new vertical development in recent years.
Long Island’s office market presents a stark contrast – an almost static development landscape. As a suburban extension of the NYC metro, Long Island has largely avoided speculative office construction for over a decade. Major occupiers looking to expand often chose other markets, and developers focused only on build-to-suit projects. In fact, since 2010 only three buildings larger than 100,000 SF have been built on Long Island. Total office inventory (about 98 million SF) grew a mere 0.4% in the last 10 years, and actually shrank ~1.5% since 2019 due to demolitions or conversions removing obsolete buildings. The lack of new supply has been a blessing in disguise: with no immediate supply glut on the horizon (only ~12,000 SF under construction as of Q2 2025), Long Island’s occupancy levels rebounded faster after the pandemic than many neighboring markets. The average vacancy held under 9%, outperforming nearby New York City and Northern New Jersey (where vacancies run 13%+ in the same period). Long Island’s office environment is defined by low-rise corporate parks and highway-centric clusters rather than flashy skyscrapers. The prime office stock is concentrated in just a few areas – Melville, Garden City, and Hauppauge account for about 25% of the island’s office inventory. These areas, mostly along the Long Island Expressway (Route 495) and major rail lines, host many headquarters and corporate campuses. Developers have focused on maintaining and repositioning existing campuses rather than building new ones. A recent example is a project in Port Jefferson Station: a 45,000 SF medical-office facility for Optum was completed and fully pre-leased (with part later subleased to a healthcare provider) – illustrating that any new construction on Long Island tends to be small scale and tied to specific tenants (often in the medical or educational field). Long Island is also seeing gradual adaptive reuse of aging offices: some properties are being converted to other uses such as industrial distribution centers or residences where feasible. Local architects note an “uptick in last-mile distribution, storage, and residential conversions” of obsolete office buildings in the region. However, such conversions face structural and zoning hurdles in the suburbs (e.g. low ceiling heights and stringent codes), meaning wholesale office-to-residential redevelopment is less common on Long Island than in Manhattan. By and large, Long Island’s “architectural evolution” is characterized by preservation and adaptation of mid-century office stock, rather than new developments – a dynamic that has kept supply in check and preserved the market’s low-rise suburban character.
Detailed Market Metrics: Long Island vs. NYC
To compare the two markets directly, the table below highlights key office metrics for Long Island and New York City as of mid-2025, based on InnoWave Studio research data:
Metric (Mid-2025) | Long Island Office | New York City Office |
Vacancy Rate | 8.4% (stable, down from 10% in 2023) | 13.5% (down slightly from peak) |
12-Month Net Absorption | +206,000 SF (positive demand) | +4,448,000 SF (return to growth) |
12-Month New Supply Deliveries | 75,000 SF (minimal new supply) | 3,000,000 SF (new towers delivered) |
Avg. Asking Rent (Overall) | $32–33/SF (below U.S. avg) | $59/SF (much higher, especially for top-tier) |
Asking Rent Growth (YoY) | +2.0% (slow growth) | +0.6% (flat to modest uptick) |
Office Inventory Size | ~98 million SF | ~974 million SF |
Under-Construction Pipeline | ~12,000 SF (virtually none) | ~9.36 million SF (peaking, then declining) |
Average Sale Price (Past Year) | $215/SF (with wide variation) | $488/SF (trophy vs. distress mix) |
Average Cap Rate (Past Year) | ~7.8% (higher yields) | ~7.4% (metro average, with bifurcation) |
Annual Investment Sales Volume | $0.34 billion (2024, lowest since 2012) | $10.1 billion (past 12 mo, off peak but improving) |
Key insights: New York City’s office market is nearly ten times the size of Long Island’s by inventory, and it commands much higher rents (reflecting the concentration of Class A Manhattan skyscrapers). However, NYC’s vacancy rate (13%+) is significantly higher than Long Island’s (8–9%), a gap that emerged as Manhattan added supply and weathered deeper pandemic disruptions. Long Island’s smaller market saw virtually no new construction, helping it maintain lower vacancy. Rental growth is modest in both markets, with tenants negotiating hard, but Long Island’s rent growth (2% YoY) slightly outpaces NYC’s sub-1% growth. In the investment arena, Manhattan office assets still fetch a premium price per SF – more than double Long Island’s average – yet cap rates are comparable or even lower in NYC for top-tier properties, indicating investors accept lower yields for Manhattan’s perceived upside and stability at the high end. Long Island’s higher cap rates reflect its slower growth prospects and smaller investor pool. Notably, transaction volume in NYC (>$10B annually) far exceeds Long Island’s ($300M), underscoring the greater liquidity and interest in the NYC market despite recent headwinds.
Leasing Activity and Tenant Behavior
New York City: Flight-to-Quality and Big-Lease Revival. In Manhattan and greater NYC, leasing activity has gained remarkable momentum. Tenants have signed new leases at a pace not seen since before COVID-19. As noted, Manhattan’s new leasing volume topped 27 million SF in 2024, surpassing the previous post-pandemic high by 9%, and the brisk activity continued into 2025 with 7.4 million SF leased in Q1 alone. This surge is driven largely by a flight-to-quality: companies are upgrading to modern, amenity-rich offices to entice employees back. Financial and legal firms are at the forefront of this relocation trend. For example, law firm Ropes & Gray inked a 390,000 SF lease at 1285 Avenue of the Americas, and Covington & Burling took 235,000 SF at the new 30 Hudson Yards tower. In the financial sector, TPG Global leased 301,000 SF at 66 Hudson Boulevard (The Spiral) and Bloomberg LP committed to 175,000 SF at 919 Third Avenue. These high-profile deals underscore tenants’ flight into trophy buildings in Midtown and Hudson Yards, particularly those near transit hubs like Grand Central and Penn Station. Indeed, submarkets such as the Plaza District, Grand Central, and Penn Plaza are seeing leasing volumes near or above pre-pandemic levels. Tenant behavior in NYC currently reflects a sense of urgency – top-grade space is finite, and the construction slowdown means fewer new options coming. In the past year, availability in 5-Star (prime) buildings dropped by 310 basis points as many large blocks were taken or removed. Tenants now fear losing out on quality offices and are increasingly renewing leases rather than risk relocating in a tightening high-end market. Despite this positive momentum, tenants still hold leverage in rent negotiations for most properties. The overall availability rate in NYC remains elevated (around 14–15%), so landlords have been offering generous concessions. Market observers note that rent discounts of around 8% off asking rents are common in negotiations. Concession packages (free rent, tenant improvement allowances) also ballooned in recent years, though their size has stabilized as the market improved. In short, NYC’s leasing market is bifurcated: coveted new buildings are increasingly landlord-favored with competition among tenants, whereas older and peripheral buildings remain tenant-favored, requiring discounts and upgrades to lease up. Another notable trend is office space removal via conversions – roughly 2 million SF of Manhattan offices have been taken off-market for residential conversion so far, with about 10 million SF more in conversion discussions. This has helped drop Manhattan’s available space below 93 million SF (the first time below 100M since 2020), contributing modestly to positive absorption. Still, the sheer volume of space on the market means tenants can be choosy and press for deals, especially outside the trophy segment.
Long Island: Steady Activity with Smaller Deals and Selective Demand. Long Island’s office leasing environment is more muted but showing signs of life after a prolonged lull. New lease transactions have now notched back-to-back years above 3 million SF, a threshold last seen in 2015–2016. Preliminary data for 2024 indicate about 3.3 million SF of leasing activity, up 8% from the prior year and the highest annual tally since 2013. This bump suggests that tenants who delayed decisions earlier in the pandemic are finally executing leases, albeit typically in smaller footprints. The average lease size in 2024 was just 3,000 SF (down from a seven-year high of 3,200 SF in 2023), reflecting Long Island’s base of small and mid-sized businesses and satellite offices. Large block leases are rare in this market; instead, occupancy gains have come from many small move-ins and expansions. Notably, demand has been geographically concentrated. Over the past 12 months, the Western Suffolk submarket led the region with nearly +480,000 SF of net absorption. This area – which includes the Melville and Route 110 corridor – benefited from several significant occupancies. For example, the Church of Scientology purchased and occupied a 62,500 SF office in Melville (Old Country Road) in 2024. Also in Melville, 2 Huntington Quadrangle saw 36,000 SF of move-ins (bringing that building to 81% leased), and in Islandia (another Western Suffolk locale) an office property gained over 63,000 SF of new tenants in late 2024 (boosting occupancy to 88%). These individual wins, while modest by NYC standards, collectively turned Long Island’s absorption positive. By contrast, some areas of Nassau County experienced sizable move-outs in recent years, which had driven the island’s overall availability to a peak of 11.5 million SF in 2023. The good news is available space has since trended down – as of early 2025, total availability was around 9.4 million SF – but one persistent challenge is elevated sublease supply. Sublet availabilities on Long Island remain near an all-time high at roughly 1.2 million SF (about 1.2% of total inventory). Major corporations have continued to shed excess space: the largest sublease block is a 310,600 SF offering at 200 Jericho Quadrangle (Jericho), and even an entire 233,000 SF building in New Hyde Park is being marketed for sublease through 2034. This overhang of sublease space indicates that some Long Island tenants are still rightsizing and decentralizing – a trend tied to hybrid work patterns.
In terms of rent and concessions, Long Island remains a tenant-friendly market overall. Average asking rents (~$32–33/SF) are below the national office average, and “asking rents remain highly negotiable” according to InnoWave Studio’s market participants. Landlords often must compete on price and incentives to secure deals. With the island’s occupancy expected to hold around 91% (vacancy ~9%), landlords recognize that pushing face rents aggressively could backfire. As such, rent discounts and concession packages are commonplace – prospective tenants can often achieve sizable rent abatements or improvement allowances, especially in aging buildings that lack the latest amenities. One silver lining: the flight-to-quality dynamic exists on Long Island too, albeit on a smaller scale. The availability rate in top-tier (4 & 5 Star) buildings has dropped from 21% at end-2023 to 15.6% by early 2025, as some high-end properties backfilled big vacancies. This suggests larger or high-credit tenants on Long Island are also gravitating to the best product (often newer or recently renovated buildings along major highways). Meanwhile, commodity 1–3 Star offices still see higher vacancy and more generous terms. Overall, Long Island’s leasing activity is improving gradually, but the market remains one where tenants have plenty of choices in most submarkets. We’re seeing landlords get creative – repurposing space for medical use, offering flexible lease terms, and investing in renovations – to lure tenants in a world where remote work has structurally reduced space needs. The expectation is for steady, if unspectacular, leasing demand going forward, driven by local business growth and the island’s strong healthcare/education sector, rather than any outsized corporate expansions.
Investment Trends and Capital Markets
Sales Volume and Investor Appetite: The investment climates in NYC and Long Island diverge in scale and dynamics, yet both have been shaped by rising interest rates and post-pandemic uncertainty. In New York City, office investment volume hit about $9–10 billion in the past year – a far cry from mid-2010s peaks, but notably stronger than the doldrums of early 2023. Each quarter since early 2023 has seen gradually improving sales activity, suggesting the market’s low point may have passed. By contrast, on Long Island office sales barely reached $336 million for all of 2024, essentially flat from 2023 and marking the slowest deal volume since 2012. Investors in both markets have been cautious, but in NYC some are starting to move off the sidelines as pricing adjusts, whereas in Long Island many have stayed on the sidelines waiting for clearer growth signals.
Pricing and Cap Rates: Asset valuation trends reflect the bifurcated nature of office performance. Manhattan office values are undergoing a significant reset in 2025, with outcomes varying widely by asset quality. According to InnoWave Studio research, cap rates have expanded across the board in NYC – stabilized Class A office buildings that once traded at sub-5% cap rates are now closer to 6.5%+ yields, and lower-quality or highly vacant buildings are trading at high-single-digit to double-digit cap rates. The average cap rate for NYC office sales in the past 12 months was ~7.4%, but that average masks the huge range of deals occurring. On Long Island, where transactions are smaller and often involve local players, cap rates have averaged around 7.8% recently – slightly higher than NYC’s average – reflecting the perception of higher income risk and lower growth in suburban offices. Pricing per square foot has fallen accordingly. In NYC, the average price is about $488/SF over the past year, but deals range from trophy properties well above $1,000/SF to distressed sales under $200/SF. Long Island’s sales averaged around $215/SF in the past year, after a ~23% drop in average price/SF from 2023. Notably, that decline brought LI pricing back in line with its five-year average (around $188–$200/SF), essentially erasing a short-lived spike.
High-Profile Transactions and Distress in NYC: Manhattan’s investment market is sending mixed signals through recent headline deals. On one hand, top-tier assets are still attracting investors at strong pricing (albeit lower than peak values). For instance, in December 2024 Munich Re purchased a 75% stake in 320 Park Avenue (a fully leased 35-story office in the Plaza District) valuing the property at $675 million – roughly $880/SF and a reported 4.75% cap rate. This sale shows that well-leased “core” assets in prime locations can still command premium valuations (though that 4.75% yield is higher than the sub-4% trophies fetched a few years ago). Similarly, many recent buyers are owner-users or long-term holders snapping up quality buildings: Bloomberg LP, as a tenant, bought its entire building at 980 Madison Avenue for $560 million to eventually occupy it entirely. On the other hand, distress is increasingly evident for older and half-empty buildings. Investors with a higher risk tolerance have been targeting these at steep discounts, often with an eye toward repositioning or conversion. In Downtown Manhattan, for example, 55 Broad Street sold for $172 million ($420/SF) and 222 Broadway sold for $147 million ($195/SF) – both are vintage office towers being eyed for residential conversion projects. A dramatic example of value erosion is 180 Maiden Lane, a 1.2 million SF Financial District tower that was 68% leased but facing major lease expirations. It traded in a short sale for $297 million (about $247/SF), representing roughly a 36% value decline from its previous sale and well below replacement cost. In an even starker case, the loan on 1740 Broadway (a 20% occupied Midtown tower) was sold for ~$180 million in 2024, a roughly 70% decline from its 2014 appraised value – signaling severe distress for certain obsolete assets. These examples illustrate a historic repricing underway in NYC’s office market: while premier assets hold much of their value, secondary ones have seen their valuations chopped by a third or more from peak levels. Overall investor sentiment in NYC is cautious but opportunistic. The bid-ask spread is narrowing as some sellers capitulate to new pricing realities and the Federal Reserve’s tightening cycle eases. The slight decline in interest rates in early 2025 has piqued buyer interest and boosted transaction appetite to a degree. However, many opportunistic funds are still waiting for more distress – particularly the wave of loan maturities looming. More than $30 billion in NYC office loans are set to mature in the next three years, and CMBS loan delinquency for NYC offices jumped from under 0.5% in early 2023 to about 6% by Q2 2025. This suggests that additional assets may come to market via foreclosure or note sales, putting further downward pressure on prices for less-competitive buildings. For well-capitalized investors, this environment presents a chance to acquire Manhattan office properties at significant discounts – either to hold for long-term recovery or to convert to alternative uses. The polar extremes of recent NYC deals (from ultra-low cap rate trophy trades to fire sales of aging towers) emphasize the importance of asset selection and strategy in this phase of the cycle.
Transaction Trends on Long Island: Long Island’s office investment scene is dominated by local and private players, and recent trends reflect a defensive, income-focused approach. According to InnoWave Studio research, private investors (including high-net-worth individuals and owner-user businesses) accounted for roughly 79% of office buying activity in the past year. Institutional investors and REITs, who make up only about 8% of Long Island’s office ownership base, have largely stayed out of the market recently – likely waiting for fundamentals (like rent growth) to improve before re-entering. The deals that did close on Long Island highlight significant value adjustments. For instance, RXR Realty offloaded two of its Long Island office assets in 2024 at steep discounts: Gateway Executive Mall in Woodbury (272,000 SF) sold for $23.5 million (approximately $87/SF); and 534 Broadhollow Road in Melville (111,000 SF) sold for $16 million ($144/SF). The Melville sale was particularly notable because the same property had sold in 2007 for the equivalent of $223/SF – the 2024 price was 35% lower than its pre-Great Recession value. These sales demonstrate how suburban office values have rolled back, in some cases, to early-2000s levels after the speculative run-up of the 2010s dissipated. On the flip side, owner-user purchases have been a bright spot on Long Island. Many businesses are choosing to buy their office facilities at favorable prices rather than lease. A prime example is the Church of Scientology’s acquisition of the 62,500 SF Melville building mentioned earlier, for over $15 million. The organization was able to secure a vacant, good-quality building and immediately occupy it, essentially taking advantage of the soft market to establish a long-term presence. Such owner-user deals make sense when pricing is low – the buyer can lock in occupancy costs and even benefit from any future appreciation. Cap rates on Long Island deals generally range in the 7–9%+ territory, depending on lease profiles. The average cap was ~7.8%, but smaller properties or those with vacancy traded at even higher yields. For example, one Melville multi-tenant building (1000 Woodbury Rd) traded with some vacancy at a double-digit cap (the sale listing showed a 28.6% vacancy at sale). Out-of-town investors have been scarce; most buyers are familiar with the local market’s slow growth and are underwriting conservatively. With 2024’s total volume barely $0.34 billion, Long Island’s office investment market is liquid but thin, meaning a few large trades (or lack thereof) can swing total volume significantly. The general sentiment is that Long Island offices are stable income plays but offer limited upside, so they attract yield-seeking private buyers more than growth-oriented institutional capital. Until we see a catalyst for rent appreciation or a significant change in demand, that dynamic is likely to continue.
Office-to-Residential Conversions and Alternative Uses: Both markets are exploring conversions as part of the investment strategy, but at different scales. In New York City, office-to-residential (or mixed-use) conversion is a hot topic and an emerging opportunity. The local government has introduced incentives and rezoning proposals to facilitate turning older office buildings (especially in Lower Manhattan and Midtown South) into housing. The sales of 55 Broad and 222 Broadway mentioned above are indicative of this trend – investors are effectively pricing these assets based on their future residential value, often significantly less than their value as offices in the past. Additionally, the announcement of a planned conversion of the Ames Building (5 Times Square) into partly residential use (with state/city support) has signaled public backing for such project. For investors, conversion opportunities in NYC can be attractive as they sidestep the weak office fundamentals by creating residential or mixed-use product that is in high demand (NYC’s housing shortage is well-documented). However, conversions are complex and not every office building is suitable – factors like floor plate depth, window layout, and zoning constraints limit the pool of candidates. Nonetheless, expect more lower-grade Manhattan offices to trade at land or conversion value in the coming 1–2 years, as the city actively promotes adaptive reuse as a solution to excess office space. On Long Island, conversions are more limited but not unheard of. Suburban office properties have seen some being repurposed into healthcare facilities, schools, or even warehouse/R&D uses. The Long Island Business News notes an increase in owners trying to reposition offices for “last-mile distribution, storage, and general industrial uses, as well as residential conversions” to meet other market needs. For example, part of the former Newsday headquarters campus was transformed into studios (Gold Coast Studios in Bethpage) and an office building in Glen Cove was converted to residential units. These cases are still relatively few, as suburban conversion faces hurdles (zoning, building design mismatches for residential, etc.). However, for investors eyeing Long Island, an office property that’s “ripe for redevelopment” (as one JLL marketing pitched it) could be an interesting play – essentially treating a well-located office site as a covered land play for future multi-family or industrial development, given the tight industrial and housing markets on Long Island. So far, though, the dominant investor approach on Long Island has been hold for income rather than convert, unless the asset is highly distressed.
Outlook and Strategic Takeaways
Near-Term Outlook (12–24 months): The office market outlook for both New York City and Long Island in late 2025 through 2026 is cautiously optimistic, but with important caveats. In New York City, office fundamentals are expected to continue trending positively in the near term. The combination of little new speculative supply in the pipeline and sustained demand for high-quality space sets the stage for further gradual vacancy compression, especially in the top-tier segment. InnoWave Studio’s forecast calls for NYC’s office vacancy to decline modestly through 2025, staying in the low-13% range and potentially dipping into the 12% range by 2026 if current leasing momentum persists. Asking rents in NYC may begin to tick up at a slightly faster pace – perhaps 1–2% annually – particularly for Class A buildings, as the available blocks of premier space become scarcer. However, rent growth will likely be constrained by the large volume of overall availability; tenants will continue to have options, and landlords will remain competitive on lease terms to maintain occupancy. The upside scenario for NYC is buoyed by its strong return-to-office trends – among U.S. cities, New York has one of the highest office utilization rates in 2025, which bodes well for companies expanding footprints. If more firms follow the lead of finance and law sectors in bringing employees back most of the week, we could see a tailwind for office demand (e.g. tech firms could reconsider downsizing). Additionally, the metro’s diverse economic engines (finance, tech, creative industries, etc.) provide a solid foundation for office space needs. That said, risks to NYC’s office outlook remain. The global and national economic picture is uncertain – any recession or major downturn would slow leasing activity and could spur a rise in sublease space as firms cut costs. Interest rates and credit availability are another concern: many landlords face refinancing challenges in the next couple of years, and distress could actually increase vacancy in the short term if struggling buildings lose tenants or delay capital improvements. The flood of loan maturities through 2028 (over $30B in NYC as noted) will test the market; some owners will default, potentially adding to the supply of space via foreclosures or forcing sales at low prices that reset comparables. In essence, NYC’s office recovery will likely be a slow grind rather than a sharp rebound, with the high end pulling ahead. Investors in NYC should prepare for a highly stratified market: newer, well-located assets should see improving occupancy and rent growth (and thus stabilizing or rising values), whereas older and vacancy-challenged buildings may continue to underperform, and some could become candidates for conversion or demolition if they cannot compete. On the policy front, watch for government initiatives that might further encourage office-to-residential conversions or provide relief for office owners – such measures could gradually chip away at excess supply and create redevelopment opportunities (for example, New York State’s proposed incentives for converting offices into housing could kickstart more projects in 2025–2026).
On Long Island, the outlook is one of stability with limited growth. InnoWave Studio’s base case forecasts Long Island’s office vacancy to hold steady in the high-8% to low-9% range through 2025, assuming no major corporate departures. With virtually no new supply on the way, even modest positive absorption (on the order of a few hundred thousand SF a year) can keep the market balanced. The expectation is for continued positive – if small – net absorption as the local economy expands gradually. Long Island’s economy, which accounts for ~12% of New York State’s GDP, is heavy in education and health services (nearly 300,000 jobs and growing ~2.6% annually). This sector is a reliable demand driver for office (especially medical office) and should support occupancies in related properties. Moreover, Long Island’s unemployment is low (around 3.3%, near pre-pandemic levels), indicating a healthy labor market that could translate to more office space needs for local businesses. However, no one is predicting an office boom on Long Island. Rent growth is expected to remain subdued, roughly tracking inflation at around 1% per year or slightly less. This is below the island’s historical average rent growth (~2.3%) and reflects the competitive leasing environment and slow demand tempo. Essentially, landlords will be doing well if they can maintain occupancies and push rents just a bit above current levels over the next two years. Upside factors for Long Island could include companies from NYC seeking back-office space or cheaper alternatives (a trend seen in past downturns), or new development in other sectors (like life sciences or higher-ed expansions) repurposing office properties. Downside risks revolve around the evolution of work patterns – if hybrid work becomes even more entrenched or if a major employer decides to downsize regional offices, Long Island could see another wave of space give-backs. Additionally, the lack of modern, high-tech office product on Long Island could make the region less competitive in attracting new companies or younger firms, which in turn keeps demand soft. Investors on Long Island are likely to continue focusing on well-leased, cash-flowing assets that can weather a flat rent environment. We anticipate cap rates to stay elevated (potentially even rise slightly if interest rates remain high), meaning valuations will primarily be driven by in-place income. There may be select opportunities to acquire properties at a discount and convert them to alternate uses (medical office, residential, self-storage, etc.) for higher returns – a strategy savvy local developers have employed when an office building’s highest and best use changes. Overall, Long Island’s office market should remain a stable niche for income-oriented investors, but significant value appreciation will be hard to come by in the short term.
Strategic Takeaways for Investors: Whether looking at the urban core or the suburbs, office investors in mid-2025 must be discerning and forward-thinking:
Quality over quantity (NYC focus): In New York City, the flight-to-quality is not just a tenant phenomenon but an investor mandate. High-quality, well-located buildings – especially those near transit and with modern specs – are positioned to outperform. Investors might target these assets, even if yields are lower, for more durable cash flow. Conversely, secondary buildings carry higher risk; value-add investors should underwrite them with realistic assumptions, potentially planning for major capital expenditures or conversion scenarios. The era of “buy and hold any Manhattan office and wait for appreciation” is over – each asset needs a concrete plan (re-leasing, repositioning, or repurposing).
Capital structure and distress opportunities: With many NYC owners facing refinancing hurdles, investors (particularly those with access to cash or low-cost capital) can find opportunities in distress. This could mean buying loans or properties out of foreclosure at a discount, or partnering in recapitalizations of struggling assets. Careful due diligence is needed to distinguish between buildings that are merely temporarily undervalued and those that are fundamentally challenged. Some distressed offices will make excellent candidates for residential or mixed-use conversion; investors with development expertise and the ability to navigate zoning and construction complexities will find unique deals in this space.
Long-term bets on conversion and redevelopment (NYC): Policy momentum in NYC is favoring conversion of older offices into housing. Investors might consider assembling capital for office-to-residential conversion projects, as the city and state are likely to introduce more incentives (tax abatements, zoning flexibility) to encourage these. Early movers in this arena can not only help reduce office inventory but also tap into NYC’s strong residential market for outsized gains.
Steady income and user-driven deals (Long Island focus): On Long Island, the strategy tilts toward income stability. Investors who know the local tenant base can succeed by acquiring properties with solid occupancy at higher cap rates (8%+) and holding for cash flow. With little rent growth, lease renewals and tenant retention are key – so assets with credit tenants or those in desirable submarkets (like along the Nassau Hub or Western Suffolk) are preferable. Additionally, owner-user acquisitions will continue to be a theme: companies looking to control their real estate may pay a premium for the right building. Investors could target assets that have an obvious end-user buyer and position those properties for sale to such users (for example, a vacant office condo or single-tenant building that could suit a medical practice or educational institution).
Watch demographic and infrastructure trends: Long Island’s future office demand will be influenced by demographic shifts and infrastructure improvements. Investors should monitor projects like the East Side Access/LIRR improvements and local economic initiatives. Areas with improving transportation links or growing populations (e.g. near new transit-oriented developments or town centers) might see relative outperformance in office space usage as employers favor locations convenient for workers. Aligning investment strategy with these trends can yield better occupancy outcomes.
Flexibility and adaptive reuse: Finally, across both markets, a prudent strategy is to build in flexibility. The office sector is in flux, and successful investors will be those who can pivot – whether that means converting an asset’s use, re-leasing it to non-traditional tenants (such as life science labs or educational institutions), or even redeveloping a site entirely. For instance, if a Long Island office park can be partially transformed into a medical campus or if a Manhattan office tower’s lower floors can be repurposed for retail or entertainment, these moves should be evaluated as part of an asset’s business plan. The ability to creatively reposition space will be a competitive advantage in the coming years.
In conclusion, the mid-2025 landscape shows that New York City’s office market is healing, led by trophy assets, while Long Island’s market is holding steady through a period of adjustment. Investors would be wise to calibrate their strategies to each locale’s realities – bet on NYC’s resilience and capacity to reinvent its office stock, and bank on Long Island’s consistency and lower volatility. With careful asset selection and an eye on emerging trends (like conversions and tenant preferences), investors can navigate the challenges and uncover value in both markets, even as the way we use office space continues to evolve.
Sources: All data and insights are based on InnoWave Studio research reports and analysis, providing the latest mid-2025 market information for Long Island and NYC office real estate.
🔹 InnoWave Studio – Long Island Office Report (July 2025)
Detailed data on Long Island’s office market: vacancy, leasing, rents, and construction trends.
🔹 InnoWave Studio – NYC Office Report (July 2025)
Market overview of NYC’s office sector, covering leasing recovery, rent trends, and development.
🔹 InnoWave Studio – Office Investment Tracker
Recent sales, cap rates, and investor activity across NYC and Long Island.
🔹 InnoWave Studio – Construction & Reuse Monitor
Updates on office developments, conversions, and adaptive reuse projects in the metro area.


Comments