
Home Depot vs. Lowe's in 2026: Store Count, Real Estate Footprint, and What Their Expansion Strategies Mean for CRE Investors
- Alketa
- Apr 15
- 9 min read

Most homeowners treat Home Depot and Lowe's as interchangeable — a coin flip between two branded logos anchoring whatever power center sits closest to their zip code. That's a reasonable consumer heuristic. It's a deeply imprecise analytical one. Over the past seven years, these two chains have pursued real estate strategies that have diverged so sharply they now represent essentially different investment theses wearing the same category label. Home Depot vs. Lowe's, as a commercial real estate question, is less about which retailer carries better plywood and more about what happens to a submarket when one brand is growing and the other is methodically contracting.
Since 2018, Home Depot has added a net 63 stores to its total count — a modest but consistent expansion arc. Lowe's has shed over 400 locations, exiting the Orchard Supply Hardware chain, divesting its entire Canadian footprint, and rationalizing dozens of underperforming U.S. boxes. The physical imprint of that divergence extends well beyond brand strategy: it shows up in cap rates, lease structures, power center vacancy rates, and the increasingly consequential question of what to do with a dark 112,000-square-foot big box in a secondary market. If you're underwriting a ground lease, structuring a power center acquisition, or advising a lender on a retail-anchored note, the Home Depot vs. Lowe's distinction isn't semantic. It's frequently the difference between a 4.5% cap and a 6.5% cap.
Two Brands, Two Very Different Trajectories
The home improvement retail sector entered 2026 on firmer ground than most retail categories can claim. According to InnoWave research, the U.S. home improvement stores industry generated approximately $285 billion in revenue during 2025 — up 2.3% from the prior year — riding a 2.4% compound annual growth rate over the preceding five years. The sector encompasses just under 4,900 operators nationally, though that figure overstates competitive diversity given how thoroughly two brands dominate the category.
Home Depot is the structural winner by a substantial margin. The company commanded 52.4% of industry revenue in 2025 — roughly $150 billion across approximately 2,350 total stores. Lowe's held 29.6% of industry revenue, generating approximately $84 billion across a meaningfully smaller U.S. footprint. That 23-percentage-point market share gap, combined with a near-doubling of revenue per store, tells the story of two chains operating the same retail format with very different financial productivity.
Metric | Home Depot | Lowe's |
2025 Revenue | ~$150B | ~$84B |
Industry Market Share | 52.4% | 29.6% |
Total Store Count | ~2,350 | ~1,748 |
Revenue per Store | ~$64M | ~$48M |
Profit Margin | 12.7% | 12.1% |
Employees | 475,000 | 300,000 |
Sources: Home Depot and Lowe's annual reports; InnoWave Studio analysis
The revenue per store differential is where the data becomes analytically interesting. Home Depot generates approximately $64 million per location annually. Lowe's runs at roughly $48 million — a gap of $16 million per store, or about 33% lower productivity per unit. That disparity compounds over a 2,000-plus-store portfolio. From a lender's perspective, the annual unit volume gap speaks directly to tenant covenant strength: a retailer generating $64 million per box has considerably more runway to absorb a challenging year than one running at $48 million.
Looking forward, InnoWave analysis projects industry revenue to reach approximately $314 billion by 2030, driven by a 1.9% CAGR — modest but durable, underpinned by aging housing stock, easing interest rates, and sustained DIY activity. Neither brand faces an existential challenge. The gap between them, however, is not closing.
What 4,000+ Big Boxes Actually Look Like on the Ground
Most coverage of these two retailers stops at financial metrics and never reaches the part that matters for site planners, developers, and underwriters: what the real estate actually looks like. The footprint differences are more consequential than the literature acknowledges.
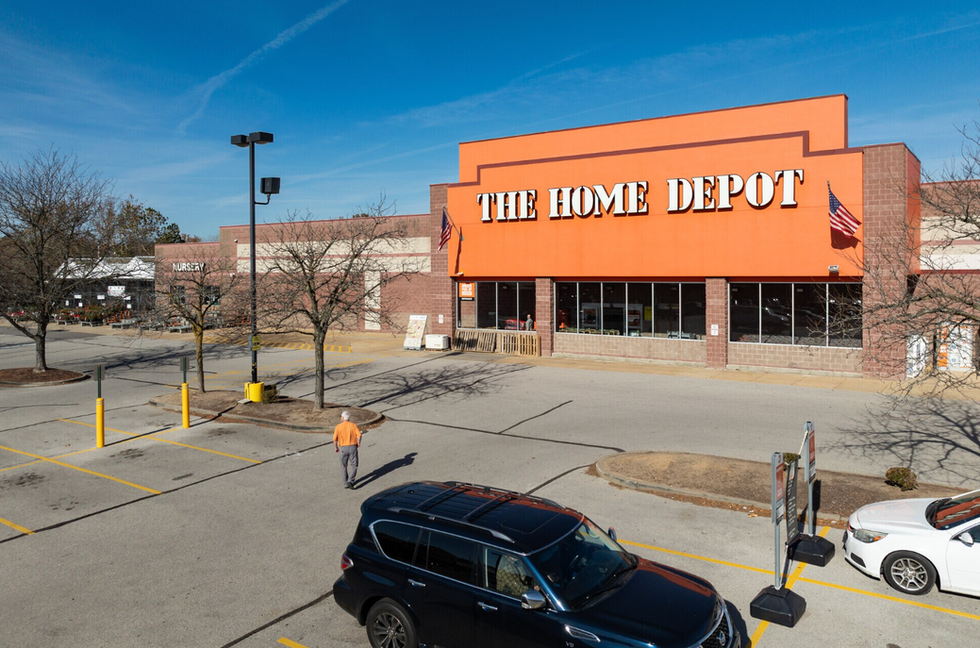
Home Depot's typical U.S. store occupies approximately 105,000 square feet of enclosed building space — a figure confirmed across a broad commercial property dataset spanning 51 locations across multiple markets. Add the enclosed or semi-enclosed garden center, typically around 24,000 square feet, and total operational area reaches roughly 129,000 square feet. The parking footprint runs at a median ratio of approximately 3.5 spaces per 1,000 square feet of building area. For a standalone Home Depot, that translates to a parcel absorbing somewhere between eight and twelve acres depending on configuration, access geometry, and outparcel allocation.
Lowe's Home Improvement runs larger. The typical store occupies approximately 112,000 square feet of enclosed building space, with a garden center that frequently reaches 32,000 square feet. The additional 7,000 square feet of enclosed building differential versus Home Depot doesn't sound dramatic until you're working through outparcel geometry: that extra square footage compresses the usable pad sites available for gas stations, quick-service restaurants, and inline retail — precisely where significant additional rent roll lives in a power center development.
Loading dock and service yard configurations also differ in ways relevant to site planning. Lowe's has traditionally operated a more prominent front-of-store garden and drive-through lumber area, requiring deeper lot dimensions — commonly 700 to 800 feet of lot depth for a full-service store versus Home Depot's somewhat more compact footprint. For developers working with irregular parcels or infill sites, that distinction can be the difference between viable assembly and a walk-away.
Both brands have historically preferred owning their real estate rather than leasing it. Per SEC filings, Home Depot and Lowe's own between 80% and 90% of their locations — a structural characteristic that directly shapes the NNN investment market. It means that when a Home Depot asset trades, it is typically a sale-leaseback or ground lease structure rather than a straightforward building sale. Supply of investment-grade Home Depot NNN product is accordingly constrained, which supports pricing.
One Brand Is Growing. The Other Is Shrinking. Here's Why It Matters.
Home Depot entered 2026 with approximately 2,350 total stores, up from around 2,287 in 2018 — a net gain of roughly 63 locations over seven years. That is not aggressive expansion by retail standards; it's disciplined, measured growth concentrated in high-density Sun Belt markets and suburban corridors where residential formation supports sustained demand for renovation and building materials. The company has been notably focused on densifying existing markets rather than planting flags in new geographies, which reflects a mature operator's preference for trade area optimization over footprint maximization.
Lowe's trajectory runs in the opposite direction, and the magnitude of the contraction requires some unpacking. From approximately 2,152 total stores in 2018, Lowe's contracted to roughly 1,748 U.S. locations by 2025 — a reduction of over 400 stores. The story has two primary chapters. In 2018 and early 2019, Lowe's shuttered its entire Orchard Supply Hardware division — a portfolio of approximately 99 specialty home improvement stores concentrated in California. These were smaller-format locations operating in a segment where Lowe's lacked the purchasing scale advantages of its primary competitor. Then, in 2023, Lowe's sold its entire Canadian operations — approximately 450 stores operating under the Rona and Lowe's Canada banners — to private equity firm Sycamore Partners for $400 million. The strategic rationale was coherent: redirect capital from markets where Lowe's competed against entrenched regional operators and concentrate investment in higher-return U.S. corridors.
The CRE implications of these exits are worth tracking directly. When a 112,000-square-foot anchor vacates a power center, the effects cascade through the rent roll. Adjacent tenants in co-tenancy-dependent leases may trigger rent reductions or termination rights depending on lease provisions — and home improvement anchors attract a predictable cluster of co-tenants (paint stores, flooring retailers, appliance concepts, contractor supply) whose business models are partially parasitic on the traffic the anchor generates. When that traffic disappears, the vacancy pressure is not limited to the 112,000 square feet going dark.
Absorption timelines for vacated 100,000-plus-square-foot big boxes in secondary markets have run 18 to 36 months based on recent commercial lease transaction records, with adaptive reuse as fitness, medical, distribution, or off-price retail among the more frequent backfill outcomes. In stronger Sun Belt markets, absorption has been materially faster — in some cases under 12 months, as discount retailers and warehouse concepts have actively pursued the format. In softer Midwest or rural markets, the backfill story is considerably harder to write. Frankly, the numbers suggest Lowe's has a tighter path to recovery in secondary markets than most NNN brokers acknowledge when pitching the credit.
Ground Leases, Cap Rates, and Tenant Credit — the Investor's View
For NNN investors, the Home Depot vs. Lowe's comparison produces a fairly clear pricing hierarchy — though the magnitude of the spread may surprise those accustomed to treating both brands as equivalent big-box credits.
Home Depot single-tenant NNN properties have traded in a cap rate range of approximately 4.25% to 5.25% in recent transaction activity, with ground lease structures at the tighter end and fee-simple building sales toward the wider end. The combination of investment-grade credit, 20-year initial lease terms with multiple 5-year options, and strong annual unit volumes makes Home Depot one of the most defensible single-tenant credits in the retail sector. The company's balance sheet carries an A-rated credit profile, and its revenue per store is sufficiently strong to absorb significant headwinds before a location becomes economically marginal.
Lowe's NNN product has traded at wider cap rates — typically in the 5.5% to 6.75% range based on recent transaction activity tracked by InnoWave — reflecting the brand's ongoing store rationalization program, its BBB+/Baa1 credit profile (a tier below Home Depot), and the market's recognition that Lowe's lease structures tend to vary more widely than the standardized documentation Home Depot negotiates. That variability introduces due diligence friction that institutional buyers price into their offers.
For power center owners, the co-tenancy mathematics matter on both the acquisition and the disposition side. An HD-anchored center and a Lowe's-anchored center present meaningfully different financing conversations, cap rate assumptions, and — critically — different residual value profiles if the anchor were to vacate. A lender underwriting a Lowe's-anchored center in a secondary market today should have a specific, documented view on backfill optionality. A lender underwriting a Home Depot-anchored center has considerably more margin to be less precise about that question.
NNN Metric | Home Depot | Lowe's |
Cap Rate Range (2024–25) | ~4.25%–5.25% | ~5.5%–6.75% |
Typical Initial Lease Term | 20 years | 15–20 years |
Credit Rating (S&P / Moody's) | A / A2 | BBB+ / Baa1 |
Ownership of Locations | ~80–90% owned | ~80–90% owned |
Typical Lease Options | Five × 5-year | Varies |
Source: InnoWave analysis of commercial lease transaction data
The Bottom Line for Investors, Developers, and Brokers
The market share and footprint divergence between Home Depot and Lowe's produces different strategic opportunities depending on where you sit in the capital stack.
For NNN investors, Home Depot commands a premium that the underlying data fully justifies. The stronger AUV, tighter credit profile, and consistent lease structure make it a category-leading single-tenant investment. But Lowe's contraction has simultaneously created a secondary opportunity: well-located former Lowe's boxes in Sun Belt markets being backfilled by off-price or fitness concepts represent value-add acquisition plays for investors willing to underwrite re-tenanting risk. The spread between a stabilized Lowe's cap rate and what those boxes can achieve post-backfill has attracted institutional interest, particularly from buyers with operational experience repositioning large-format retail.
For developers, Home Depot's selective but sustained expansion pipeline keeps ground lease and pad site opportunities alive in suburban Sun Belt markets with active residential formation. Home Depot's preference for owning its real estate has historically made it a more complex ground lease partner than other big-box operators, but sale-leaseback structures have become more frequent as both retailers optimize capital allocation. Understanding Home Depot's site selection profile — large-format suburban corridors, proximity to contractor trade channels, median household income thresholds — is prerequisite intelligence for any developer pursuing power center assemblage in a growth market.
For brokers, the divergence means structurally different pitch books. An HD-anchored power center underwriting conversation and a Lowe's-anchored one are not the same conversation. That's not an indictment of Lowe's as a tenant; it's a recognition that the investment community has already absorbed the trajectory story, and that story currently points in opposite directions.
Two Different Buildings, Two Different Investment Cases
The consumer question — Home Depot or Lowe's — gets settled by proximity and loyalty. The investor question is materially more differentiated. Home Depot's $64 million in annual unit volume, disciplined footprint expansion, and A-rated credit produce an asset that the NNN market prices accordingly. Lowe's strategic rationalization has created a smaller, more focused portfolio — but also a larger inventory of vacant or transitioning big boxes working through a re-tenanting cycle that ranges from straightforward in the Sun Belt to genuinely difficult in secondary markets.
Whether you're buying the building or the ground underneath it, the analysis begins the same way it does for any other CRE decision: who is the tenant, what are they generating, and what does their five-year trajectory look like? On all three dimensions, Home Depot and Lowe's give you very different answers in 2026. The logos might look interchangeable from the highway. The cap rates do not.
Sources:
Company Financials & SEC Filings Home Depot,
Inc. Annual Report (Form 10-K) FY2024 ,
Lowe's Companies, Inc. Annual Report (Form 10-K), FY2024
InnoWave Studio — Home Improvement Stores in the US, Industry Analysis (2025)
InnoWave Studio — Hardware Stores in the US, Industry Analysis (2025)
Marcus & Millichap — Net-Leased Retail Research, 2024–2025
CBRE — U.S. Retail Investment Outlook, 2025
Chain Store Age — Lowe's Canada Divestiture Coverage, 2023
GlobeSt — Big-Box Retail Absorption & Dark Box Data, 2024
Retail Dive — Home Improvement Sector Analysis, 2024–2025