
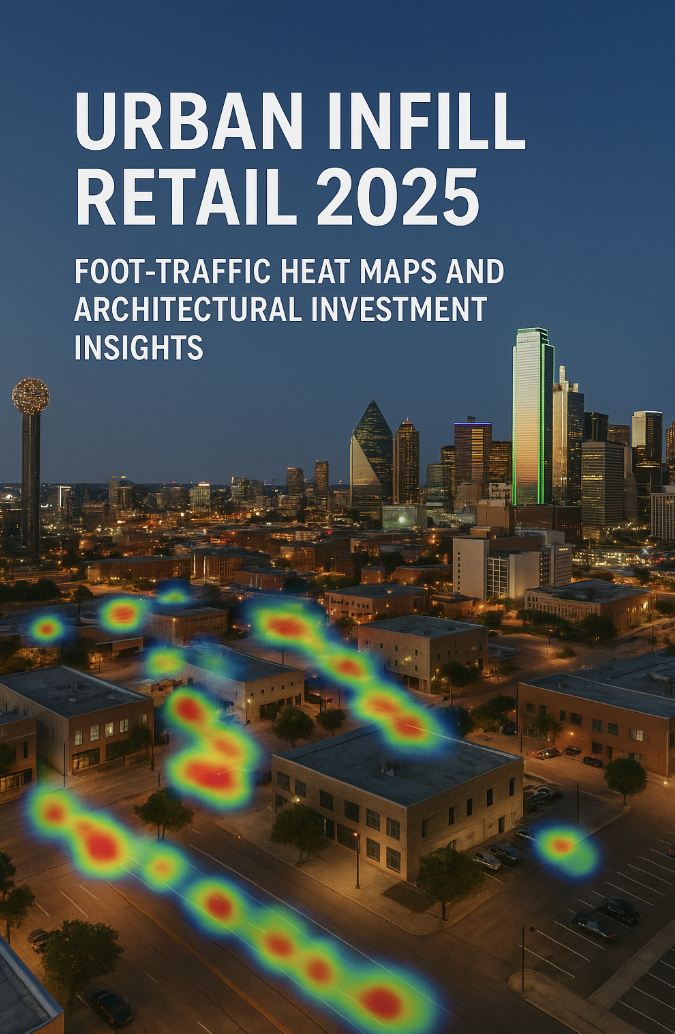
Urban Infill Retail 2025: Foot-Traffic Heat Maps and Architectural Investment Insights
- Alketa

- Jul 24, 2025
- 11 min read
Updated: Apr 3
Introduction
Urban infill retail development is emerging as a prime opportunity in 2025’s real estate investment landscape. Despite e-commerce growth, physical stores still account for roughly 72% of U.S. retail sales, and 55% of retail brands cite winning foot traffic as their biggest challenge. In response, developers and investors are turning to data-driven site selection – especially using foot-traffic heat maps derived from mobile device tracking – to pinpoint high-potential locations. This report explores the most commercially attractive U.S. metro markets for urban infill retail in 2025, how cutting-edge foot traffic datasets give investors a competitive edge (and even enable marketing media attribution), and the architectural implications of infill strategies (from adaptive reuse to mixed-use design and zoning). The goal is a comprehensive, professional yet accessible guide to help both financially minded and non-technical readers understand the real estate investment trends shaping infill retail success in the U.S. market.
Top U.S. Metro Markets for Urban Infill Retail Development in 2025
Certain U.S. metropolitan areas stand out in 2025 for strong urban infill retail prospects, thanks to robust population growth, foot traffic recovery, and supportive infrastructure. According to a 2025 CBRE market outlook, several Sunbelt cities and emerging hubs are “markets to watch” due to their demographic and economic momentum:
Metro Area | Key Drivers of Retail Growth (2025) |
Phoenix, AZ | Rapid population gains (young families & retirees) driving top-tier retail performancem. Ongoing infrastructure investments and new developments bolster foot traffic, attracting national and local retailers. |
Austin, TX | Thriving tech-driven economy and fast population growth fueling retail demand. An influx of high-income residents and creatives creates strong appetite for diverse urban retail experiences. |
Dallas, TX | Robust job and population growth (tech and finance sectors) make Dallas one of the nation’s top retail markets. Low space availability and high absorption reflect intense competition for well-located infill sites. |
Nashville, TN | Booming tourism and a growing healthcare sector sustain foot traffic and retail spending. The city’s popularity with younger residents spurs mixed-use infill projects, and retail vacancy is among the lowest in the country. |
Charlotte, NC | Expanding finance and tech industries draw young professionals. This demographic shift increases demand for walkable “lifestyle” retail centers and urban mixed-use developments. Affordable living costs and a warm climate further entice major retailers to infill locations. |
Other established metros like New York City, Los Angeles, and Chicago also remain significant for infill retail, but their growth is more tempered. In 2025, real estate investment trends favor cities with strong in-migration and job creation, where new urban retail can fill pent-up demand. Markets such as Phoenix, Austin, Dallas, Nashville, and Charlotte exemplify this trend, combining population and economic growth with a push for denser, walkable development. Investors eyeing these metros can leverage granular foot traffic heat maps to zero in on the best neighborhoods and census tracts for retail projects.
Foot-Traffic Heat Maps: A Data-Driven Lens on Site Selection
Traditionally, choosing a new store site or redevelopment location involved a degree of guesswork and intuition. In 2025, however, foot traffic data has become a game-changer for retail site selection. By aggregating anonymous mobile phone location signals, analysts can create foot-traffic heat maps down to the census tract or city block level, revealing exactly where pedestrians concentrate throughout the day. These hard-to-collect datasets (sourced from GPS pings, app location sharing, and other mobile tracking) offer a microscopic view of consumer movement that was previously unavailable.
Using Foot Traffic Data for Market Analysis: Commercial real estate professionals increasingly incorporate foot traffic analytics to enhance site selection and market research. Foot traffic data enriches traditional datasets by providing “real-world insights” on where people actually go and how long they stay. By examining patterns of movement, developers can “go where the people are,” identifying neighborhoods that consistently draw crowds or are trending upward post-pandemic. In the wake of COVID-related relocations and shifts in work patterns, these insights help pinpoint which urban districts are rebounding or growing the fastest in terms of daily activity.
Identifying High-Opportunity Areas with Heat Maps: Advanced location intelligence platforms allow investors to visualize foot traffic intensity as color-coded maps. By plotting foot traffic counts by census tract, one can literally see the “hot spots” – for example, a cluster of blocks with heavy lunchtime pedestrian volumes, or a transit-adjacent tract that attracts commuters and shoppers. According to location data analysts, layering footfall heat maps with demographic and migration data enables businesses to “identify high-potential areas before competitors do” and avoid opening stores in low-traffic zones. In practice, a developer might use these maps to discover an under-served infill location that quietly enjoys high footfall (say, near a busy bus stop or university) and secure it ahead of the market.
Benefits of a Data-Driven Approach: Incorporating mobile-device foot traffic metrics takes the guesswork out of site selection and adds quantifiable context. Unlike traditional metrics (population counts, vehicle traffic, etc.), foot traffic data shows actual behavioral patterns – it reveals not just where people live or drive, but where they spend time on foot, which is critical for retail. This data can fill information gaps and provide “an added layer of real-world insights and rich context” beyond what typical market studies show. Savvy investors analyze historical foot traffic trends as well, to ensure a location’s popularity is sustainable and not just a current blip. By studying multi-year pedestrian counts, one can differentiate a truly enduring retail corridor from a short-lived fad, thus de-risking long-term investments.
Gaining a Competitive Edge with Hard-to-Collect Data
Foot traffic datasets at this granular level are notoriously difficult to gather, requiring sophisticated aggregation of signals from millions of mobile devices while respecting privacy. As a result, these insights are a relatively hard-to-access asset – which is exactly why they can confer a strong competitive advantage to those who have them. In fact, commercial real estate experts note that in today’s crowded market, leveraging foot traffic data allows professionals to “differentiate themselves by offering investors deeper insights and a more nuanced understanding of market opportunities.” This data-driven edge can mean the difference between confidently investing in an emerging retail hotspot versus missing the trend or picking the wrong block.
From a technological standpoint, location data companies use GPS pings and advanced algorithms to transform raw movement data into meaningful foot traffic metrics. Providers like Unacast or SafeGraph compile curated foot traffic datasets that can tell how many people visit a given location daily, their average dwell times, and even where they came from (home or work neighborhoods) in aggregate. Such detail was once unimaginable to the average real estate investor. Now, those who integrate these insights into their strategy gain a first-mover advantage in identifying sites with untapped consumer demand.
Moreover, because privacy regulations limit data collection, not everyone can easily obtain these insights – making them a semi-secret weapon. A SafeGraph industry guide notes that “one of the biggest struggles with footfall data” is navigating privacy and regulation, so many datasets are anonymized and aggregated to provide trends without personal identifiers. The upshot is that those willing to invest in proper data (and analytics talent) can unlock valuable knowledge that casual observers or late adopters simply won’t have. This exclusivity in data translates directly into competitive positioning.
Media Attribution and Multi-Use of Data: An often overlooked benefit of collecting foot traffic data is that it can be reused for marketing attribution. The same way online marketers track clicks, physical retailers can track foot visits triggered by ads – a practice known as foot traffic attribution. This technique measures how many people showed up at a store after seeing a particular advertisement. By linking marketing campaigns to real-world visits, businesses can “accurately measure the ROI of their advertising spend”. For developers and retail investors, this means that after selecting a prime infill site, they can also quantify how signage, promotions, or media coverage drive incremental foot traffic to that location. In essence, the hard-to-get foot traffic dataset serves double duty: first in site selection and later in ongoing performance measurement. It provides a feedback loop to optimize marketing strategies, refine tenant mix, or adjust store layouts based on where customers are coming from and what draws them in. Those who leverage footfall analytics for attribution gain a clearer picture of customer behavior and a “competitive edge by having access to detailed insights that others may lack.” In 2025’s omnichannel retail world, such data-driven feedback is invaluable for continuously improving a site’s profitability.
Architectural Implications: Infill-Friendly Design and Zoning
Selecting the right location is only part of urban infill retail success. Equally important is designing or adapting the physical space to thrive in a dense urban environment. Infill retail projects often involve “filling in” underutilized city spaces – whether by constructing new buildings on vacant lots, inserting retail into mixed-use developments, or repurposing existing structures. Below we discuss key architectural and planning considerations: building typologies, adaptive reuse, mixed-use integration, and zoning.
Adaptive Reuse and Building Typologies: Urban infill frequently capitalizes on adaptive reuse – converting older buildings (offices, warehouses, historic structures) into new retail or mixed-use spaces. This approach not only adds character and sustainability benefits, but can also accelerate project timelines and improve returns. According to a 2025 Urban Land Institute report, adaptive reuse projects are often outperforming new construction by “delivering faster returns, reducing risk, and catalyzing community revitalization.” The business case is compelling: reusing an existing building can mean lower acquisition costs (since the structure is already there) and shorter time to market, and may unlock tax credits or zoning incentives for preservation. For example, a developer might take a vacant warehouse on a city block and transform it into a retail marketplace. By doing so, they avoid the lengthy process of ground-up construction and tap into historic preservation grants or adaptive reuse zoning overlays that some cities offer. The ULI study found that such projects often “yield a strong ROI” while also sparking broader neighborhood renewal. Old buildings come with unique architectural features – high ceilings, brick facades, quirky layouts – that, when embraced, create distinctive retail environments not easily replicated by new malls. These character-rich spaces can become destinations in themselves, attracting shoppers looking for authentic experiences.
In terms of infill-friendly building typologies, successful urban retail often means smaller footprint stores, multi-level layouts, or vertically integrated mixed-use buildings. Unlike sprawling suburban big-box stores, urban infill retail must work within tighter lot sizes and existing street grids. Retailers and developers have responded by designing flexible formats: e.g. a grocery store or pharmacy might occupy the ground floor of a mid-rise residential tower, with parking hidden underground or off-site. Buildings may include retail podiums with offices or apartments above – leveraging the built-in customer base of those upper-floor uses. Mixed-use integration is a hallmark of modern infill: blending retail, dining, housing, and offices to create 18-hour active districts. This integration aligns with consumer preferences for walkable, experience-rich neighborhoods and also maximizes the usage of expensive urban land. Indeed, real estate trends highlight that walkable urban areas command price premiums for retail, office, and residential rents – on the order of 35-45% higher than drivable suburban areas – indicating pent-up demand for more infill development. By adopting building typologies that mix uses (ground-floor shops, upper-level living/working spaces), developers tap into this value and create self-sustaining foot traffic ecosystems.
Zoning and Policy Considerations: Navigating local zoning is perhaps the most critical step in any infill project. Urban infill retail often requires threading the needle of regulations or even advocating for changes. Zoning laws dictate where retail can go, how large it can be, and what form it can take. Inflexible or outdated zoning can stymie great infill ideas – for instance, a parcel might be zoned only for industrial use when it’s actually perfect for a retail repositioning. The Urban Land Institute emphasizes that rigid zoning codes contribute to “high land costs, underutilized sites, and missed investment opportunities.” Investors who skip zoning due diligence risk ending up with a property they can’t use as intended. Thus, forward-thinking developers often work closely with city planners or hire land-use attorneys to explore solutions like variances, rezonings, or utilization of special overlays (transit-oriented development zones, mixed-use districts, etc.). The good news is that many U.S. cities in 2025 are actively updating zoning to be more infill-friendly. There’s a movement toward form-based codes that focus on building shape and integration rather than segregating uses – an approach that “supports walkable, mixed-use environments and helps streamline the entitlement process.” Cities are also introducing adaptive reuse ordinances to make it easier to convert, say, an old office building into ground-floor retail with apartments above.
For developers, understanding these zoning shifts is crucial. If a city has recently lessened parking requirements in transit-rich areas or created a new mixed-use infill zone, those policies can significantly reduce project costs and approval times. On the flip side, infill projects might face neighborhood resistance or design review hurdles that require careful planning. Engaging the community and showcasing how an infill retail project will enhance the neighborhood’s walkability and vitality can often help in securing approvals. In any case, aligning architectural plans with zoning realities (or proactively seeking zoning flexibility) is key to turning a high-foot-traffic site into a viable retail development.
Data-Driven Site Selection Enhances Yields and ROI
Ultimately, the appeal of combining foot-traffic data insights with smart urban design is in the financial performance. Data-backed site selection directly translates to stronger project yields for developers and higher ROI for investors. The logic is straightforward: a store or retail development sited in a high foot-traffic, demographically suitable location will generate more sales and sustain higher rents than one in a mediocre location. By using analytics to find those golden sites and guide investment decisions, stakeholders can materially improve their outcomes.
Consider a real-world example: A national retailer used foot traffic heat maps, neighborhood migration trends, and competitor benchmarks to plan its expansion. The result was **“better-performing stores in high-opportunity areas, more efficient allocation of marketing dollars, and a measurable boost in same-store sales.”* In other words, data-driven placement meant each new store had a built-in advantage, attracting more customers and revenue than the chain’s older, less-optimized locations. From a landlord or developer perspective, a retail property in a foot-traffic hot zone can command premium rents and maintain high occupancy, which drives up its net operating income and valuation. Investors see this in the form of higher cap rates on exit or stronger cash flow during hold periods.
Moreover, foot traffic data allows for precise media attribution, as discussed, which means marketing spend can be fine-tuned to drive in-store visits efficiently. This avoids wasted budget and further boosts the profitability of a given site. A study on foot traffic attribution highlights that businesses can “accurately measure how marketing efforts translate into physical store visits”, enabling them to optimize campaigns and improve ROI. For an investor, this means tenant sales (and thus percentage rents or rent stability) are maximized, and the retailer is more likely to succeed – reducing the landlord’s risk of turnover. In essence, data-driven site selection is a form of risk management: it stacks the deck in favor of success by selecting locations based on evidence of demand.
Financially, these practices contribute to superior performance metrics. Properties in walkable, infill locations have shown higher appreciation and resilience. For instance, walkable urban retail areas have been gaining market share and saw rent premiums persist even through the pandemic. Adaptive reuse projects, as noted by ULI, often achieve faster lease-up and “higher occupancy rates, higher property values” as they revitalize neighborhoods. All these factors enhance yield. Developers who incorporate flexibility (for example, designing spaces that can adapt to different retail types or converting upper floors to offices or residences if needed) also future-proof their investments, ensuring consistent returns even if market conditions change.
Conclusion
Urban infill retail in 2025 represents a compelling intersection of data science and design savvy. Foot-traffic heat maps and mobile location analytics provide unprecedented clarity on where the next great storefront or mixed-use project should rise, giving developers and investors a critical edge in site selection. These hard-won insights, when reused across operations (like tying ad campaigns to footfall), further amplify a project’s success by aligning marketing and location strategy. Meanwhile, on the ground, thoughtful architectural approaches – from adaptive reuse of beloved old buildings to integrating shops seamlessly into walkable, mixed-use complexes – ensure that new retail spaces truly resonate with urban consumers and communities. The U.S. market’s most attractive metro areas for infill retail are those combining growth with urbanization, and within them, the highest returns will go to those who choose their sites wisely and build for the future. By marrying data-driven site selection with infill-friendly development practices, retail investors can enhance yields, reduce risk, and create vibrant urban destinations that stand the test of time.
Sources: The analysis above references
industry data and insights from 2023-2025,
including reports by CBRE on top retail markets,
location intelligence experts on foot traffic analytics,
Urban Land Institute findings on adaptive reuse benefits, among others.
These sources underscore the power of leveraging “retail site selection data” like foot traffic patterns alongside innovative design and planning to capitalize on 2025 retail development opportunities.


Comments